ENH Marketing

Campaign Intelligence in Dubai

ENH Marketing helps UAE businesses plan campaign budgets using historical performance, relevant benchmarks and forecast ranges. We estimate what a budget could produce, recommend how it should be divided between channels, and monitor whether the campaign is performing within the expected range.

Chat on WhatsApp

What Does ENH Do for  AI Campaign Intelligence? 

Campaign intelligence gives marketing teams a clearer basis for planning and reviewing paid media. Before the campaign begins, we assess the objective, budget, audience, channels, and available performance data. We then prepare forecast ranges for the metrics that matter to the business.

Once the campaign is running, actual results are compared with the forecast. This helps identify problems early and supports better budget decisions. The service is customised to the business, category, campaign objective and quality of available data.

  1. Pre-Campaign Performance Forecasting

    We estimate what a proposed advertising budget could deliver before spending begins. Depending on available data, forecasts may cover reach, website visits, enquiries, qualified opportunities, acquisitions and revenue, with expected ranges and assumptions clearly stated.

  2. Media Mix Planning

    We recommend how to allocate budgets across Google, Meta, LinkedIn, TikTok, YouTube and other relevant channels. Planning considers campaign objectives, audience behaviour, historical performance, creative availability, sales cycles and each platform’s capacity to spend efficiently.

  3. Category Performance Benchmarking

    We compare campaign performance against relevant industry or category benchmarks where sufficiently comparable data exists. Metrics may include cost per click, conversion rate, cost per lead, acquisition cost and return on ad spend, using consistent objectives and definitions.

  4. Budget Scenario Planning

    We model how changing budgets, channel allocation, audiences or campaign objectives could affect expected results. Each scenario presents a potential performance range, highlights the assumptions behind the estimate and helps decision-makers compare options before committing advertising spend.

  5. Early Performance Alerts

    We monitor live campaigns for results that move outside expected ranges while budgets remain active. Alerts may flag rising costs, declining conversion rates, weaker lead quality, inefficient channel spending or missing CRM conversions, prompting investigation and timely optimisation.

  6. Forecast Versus Actuals

    We compare forecast estimates with actual campaign results to identify where performance met or differed from expectations. Reporting reviews assumptions, channel contributions and budget adequacy, while new reliable data informs revised forecasts and future planning decisions.

All CampaignsOct 1, 2026 – Oct 31, 2026vs. Sep 1, 2026 – Sep 30, 2026Last 30 days
  • Total Spend

    AED 48,750

    12%vs. previous period

  • Leads Generated

    682

    18%vs. previous period

  • Qualified Leads

    214

    27%vs. previous period

  • Cost per Lead (CPL)

    AED 71

    25%vs. target (AED 95)

  • Acquisitions

    48

    20%vs. previous period

  • Revenue Generated

    AED 384,000

    28%vs. previous period

Forecast vs. Actual Performance

LeadsCost per LeadConversionsAcquisition Cost
01753505257001 Oct4 Oct7 Oct10 Oct13 Oct16 Oct19 Oct22 Oct25 Oct28 Oct31 Oct

Total Leads

682

Forecast

600 – 700

Within range

+14%

vs. forecast (600)

Performance Alerts

View all (3)
  • Meta Ads – CPL above target

    2h ago

    CPL is 42% higher than target (AED 110 vs. AED 77)

    Impact: Higher acquisition cost

    Action: Review audience targeting and ad creatives

  • Google Ads — Spending faster

    5h ago

    78% of monthly budget spent with 10 days remaining

    Impact: Risk of budget overspend

    Action: Adjust daily spend limits

  • LinkedIn Ads — Leads below forecast

    1d ago

    Lead volume is 32% lower than forecast (48 vs. 71)

    Impact: May affect pipeline targets

    Action: Review targeting and content strategy

  • Conversion rate improvement

    1d ago

    Overall conversion rate is 28% higher than last period

    Impact: Positive performance trend

    Action: Consider increasing budget

Channel Performance & Budget Allocation

ChannelBudget (AED)Spend (AED)% of BudgetLeadsCPL (AED)ConversionsConv. Rate
Google Ads25,00022,80047%31273289.0% 18%
Meta Ads20,00018,40038%19893126.1% 12%
LinkedIn Ads8,0006,20013%689165.8% 32%
Other Channels5,0003,3507%104321211.5% 24%

Spend by Channel

AED 48,750Total Spend
  • Google Ads47%
  • Meta Ads38%
  • LinkedIn Ads13%
  • Other Channels7%

Commercial Outcome Funnel

  1. Ad Spend

    AED 48,750

  2. Leads

    682

    CPL: AED 71

  3. Qualified Leads

    214

    31% of leads

  4. Opportunities

    96

    45% of qualified

  5. Acquisitions

    48

    22% of opportunities

  6. Revenue Generated

    AED 384,000

    CAC: AED 1,016

Key Commercial Metrics

vs. previous period
  • Cost per Qualified Lead

    AED 228

    18%

  • Customer Acquisition Cost (CAC)

    AED 1,016

    22%

  • Marketing Generated Pipeline

    AED 1,152,000

    26%

  • Return on Ad Spend (ROAS)

    7.9x

    28%

A forecast is only as useful as the information behind it.

Depending on the scope, we may review:

  1. 01Previous advertising spend
  2. 02Campaign objectives and conversion events
  3. 03Impressions, clicks and website sessions
  4. 04Leads, purchases, bookings or enquiries
  5. 05CRM opportunity and sales data
  6. 06Revenue or sales pipeline
  7. 07Channel and campaign breakdowns
  8. 08Audience and location data
  9. 09Landing page performance
  10. 10Campaign dates and seasonal changes
  11. 11Promotions, offers and creative changes
  12. 12Tracking gaps or changes in conversion setup

A business does not need to have every item on this list.

The diagnostic establishes what is available and how confidently it can be used.

Before the campaign

Confirm Campaign Goals

We establish what the campaign needs to achieve and how success will be measured. Form submissions, qualified leads, sales opportunities and completed purchases represent different outcomes, so we agree on the primary conversion goal before forecasting begins.
Before the campaign

Review Available Data

We assess data from advertising platforms, analytics, CRM systems and sales teams. We identify inconsistencies such as duplicate leads, differing attribution periods and mismatched conversion definitions to establish a reliable basis for forecasting and performance comparisons.

Before the campaign

Establish Forecast Ranges

We use relevant campaign history and ENH benchmark data where comparable information is available. Industry, objective, platform, audience, location, offer and conversion definitions inform the estimate. Where reliable data is limited, we use wider ranges and clearly state the assumptions.

Before the campaign

Model Budget Scenarios

We estimate how different budgets and channel combinations could affect campaign results. Each scenario outlines the expected performance range, proposed media allocation and underlying assumptions. Where sufficient historical data exists, predictive analysis or media mix modelling may also be considered.

Campaign starts

Compare Forecasts With Actuals

Once the campaign is live, we compare actual results against the forecast range. This helps identify rising costs, declining conversion rates, weaker lead quality or channels underutilising their allocated budgets while there is still time to respond.

Campaign live

Optimise Campaign Performance

We refine budget allocation and update forecasts as reliable data becomes available. Adjustments are based on performance against the expected range and agreed commercial objectives, helping guide decisions beyond simple month-on-month comparisons.

  1. 01

    Business Goal & Available Data

    • Targets
    • Budget
    • Campaign History
    • CRM Data
  2. 02

    Forecast & Benchmark

    • Expected Results
    • Relevant Benchmarks
    • Assumptions
    • Scenario A

      Current Budget & Mix

    • Scenario B

      Adjusted Budget & Mix

  3. 03

    Monitor & Optimise

    • Compare Actuals
    • Flag Variances
    • Reallocate Spend

ENH helps you , and across suitable channels. We review your campaign history, tracking and sales data, then compare the plan with relevant category benchmarks where enough comparable information is available.

Once the campaign begins

Once the campaign begins, we compare actual performance with the forecast and identify , or early.

Tell us what the campaign needs to achieve, the budget being considered, and what performance data is currently available.

The proof — 28 client stories

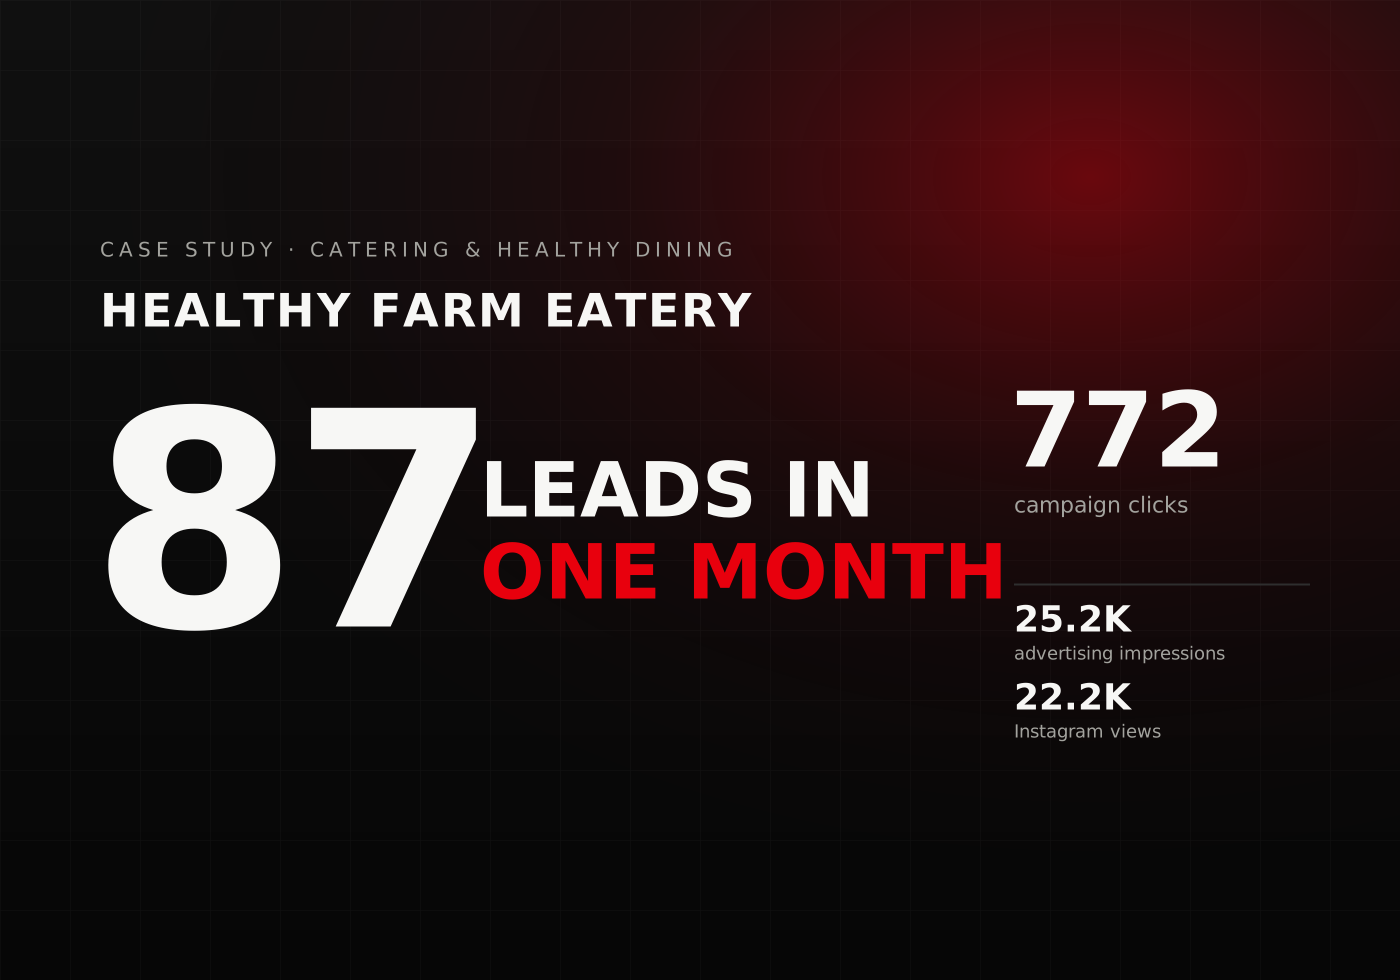
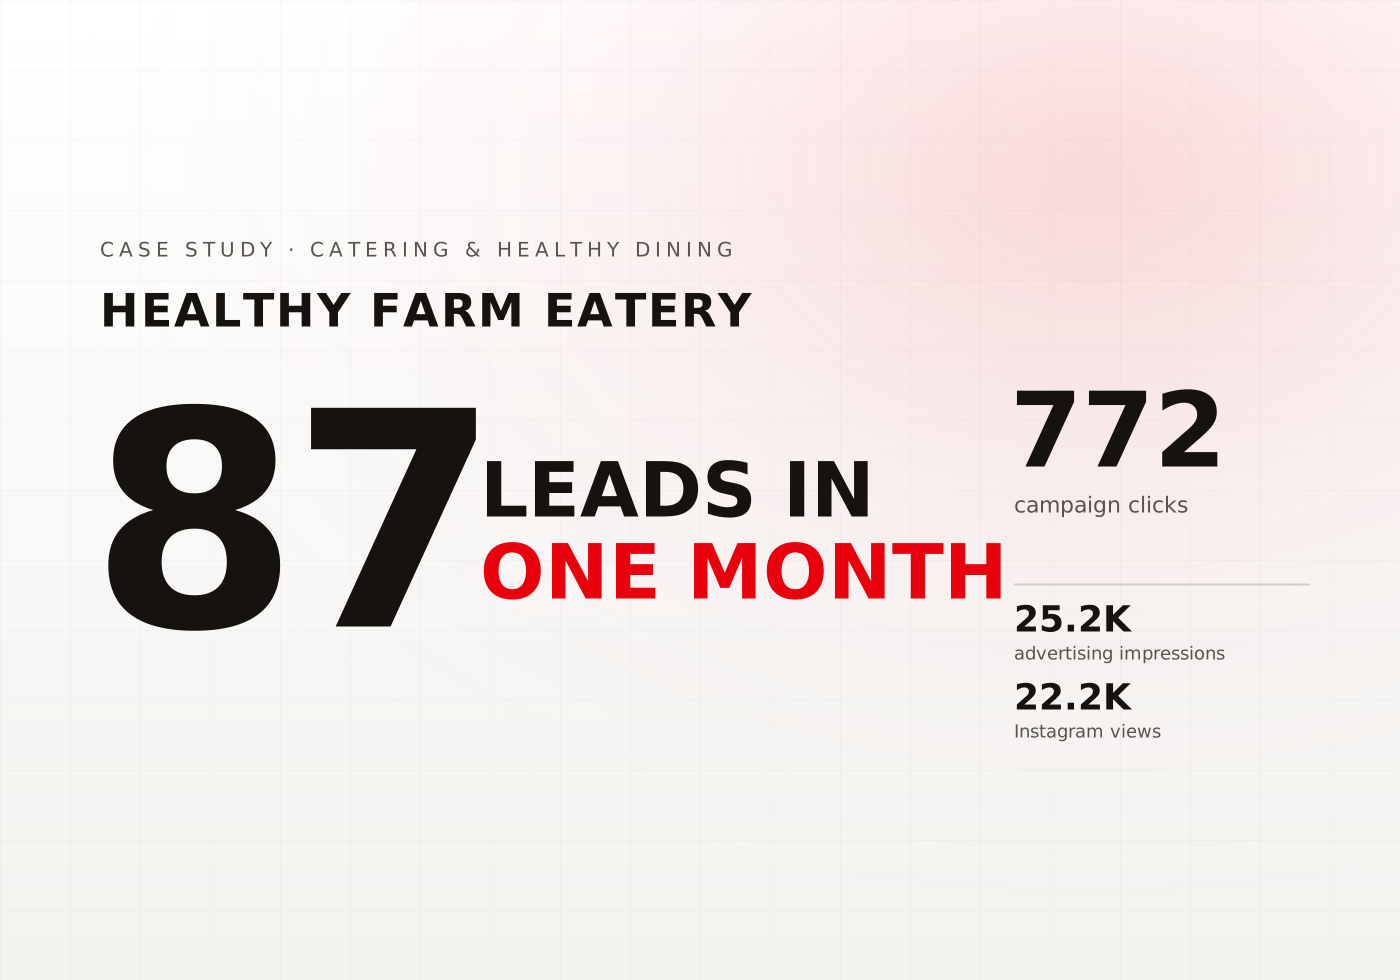
Healthy Farm Eatery case study cardHealthy Farm Eatery case study card

Healthy Farm Eatery

Consistent Sales Growth Driven by High-Quality Lead Generation

211%
Exceptional growth in social media reach within 30 days
209%
Significant increase in content visibility and impressions
80%
Strong expansion in Instagram audience reach
60+
High-quality leads generated driving sales opportunities
Read the case study
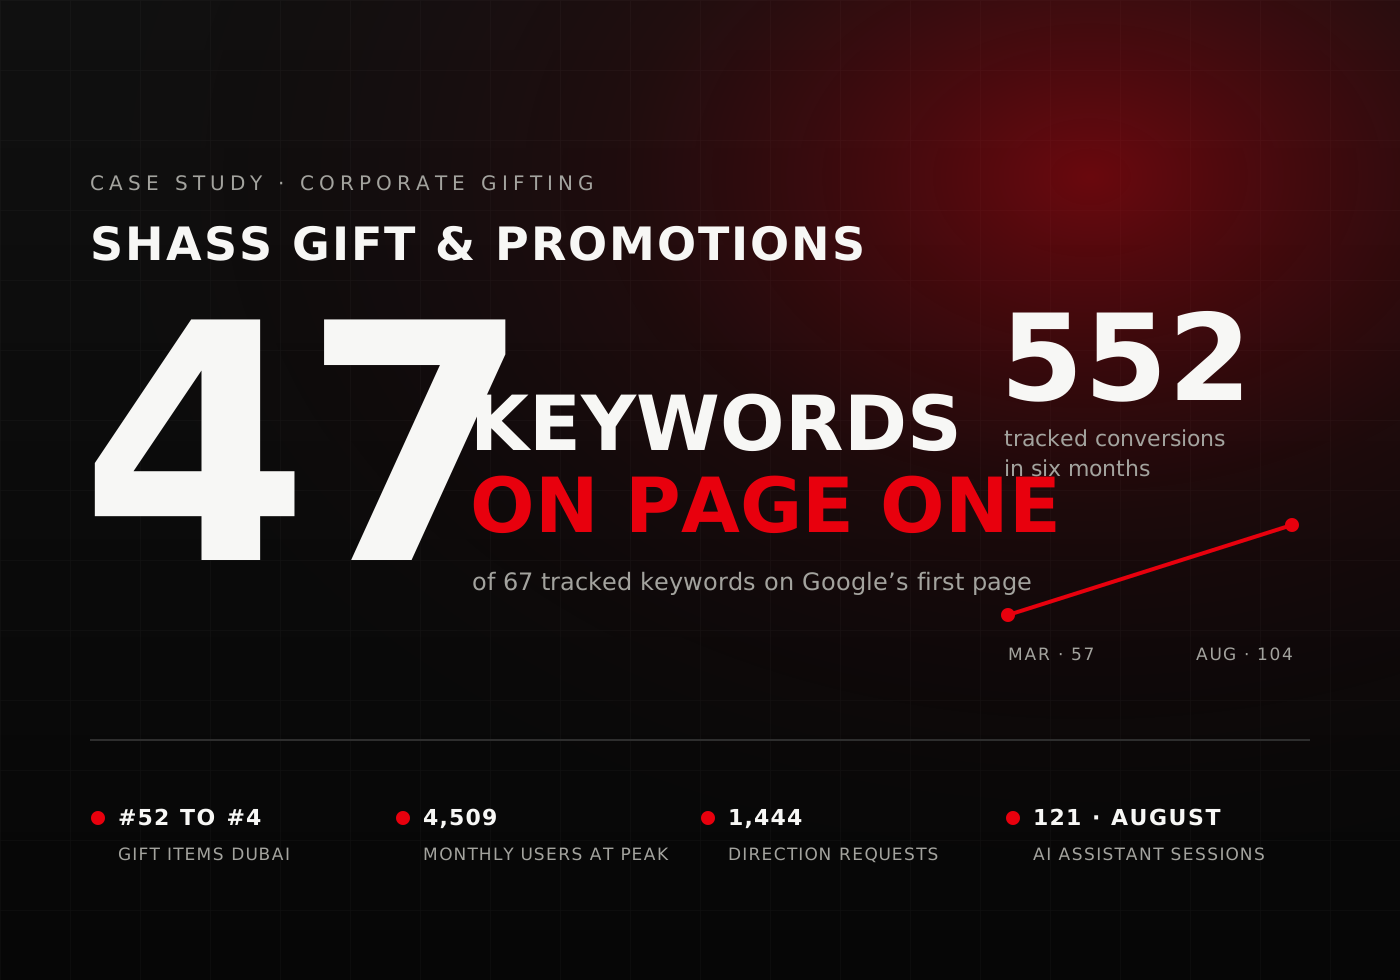
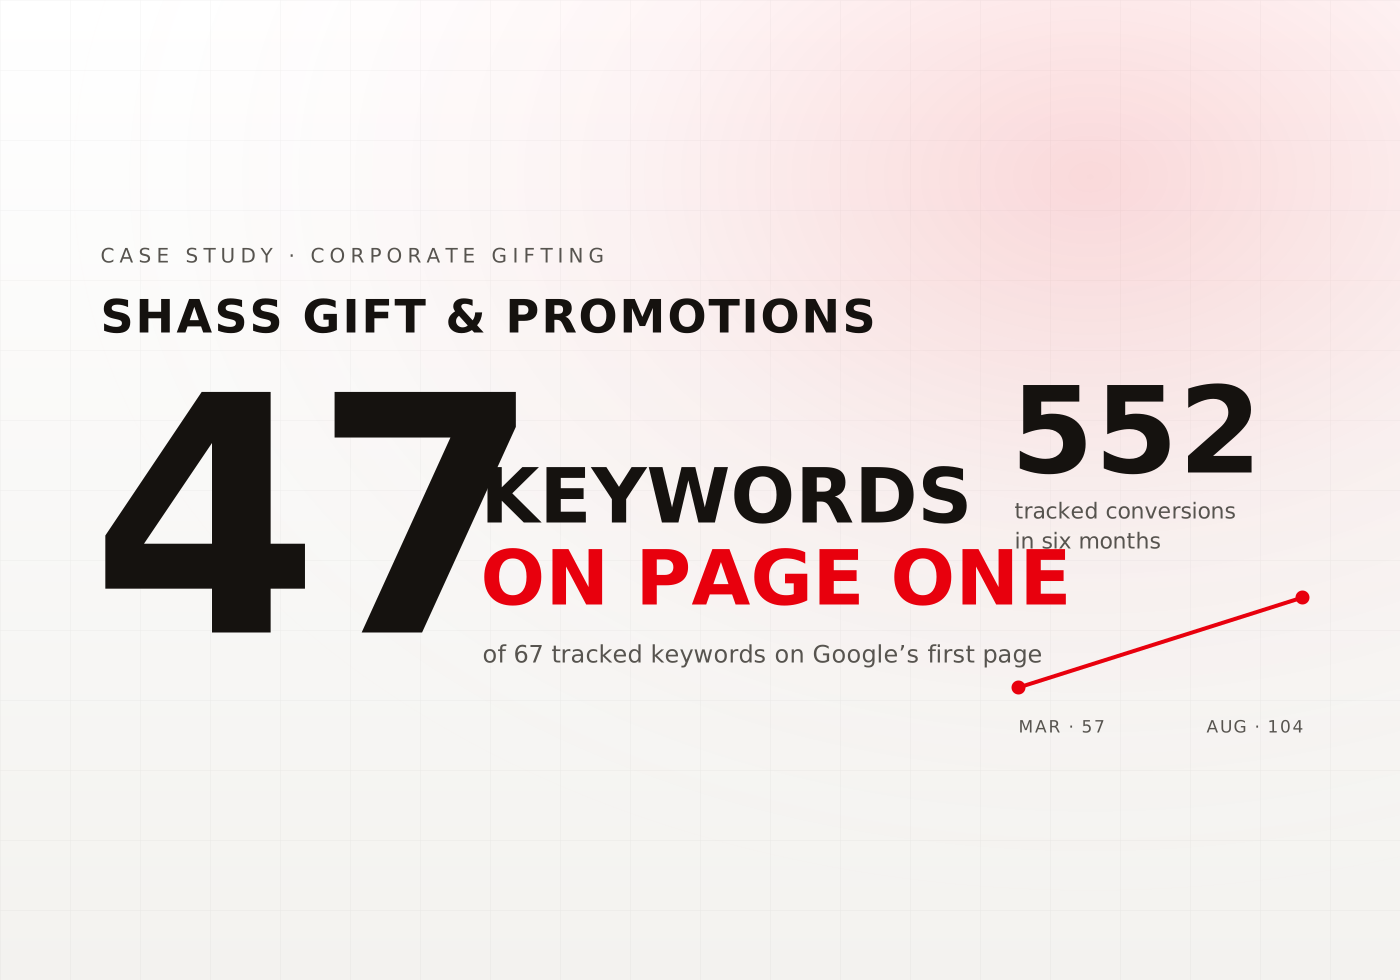
Shass Gift & Promotions case study cardShass Gift & Promotions case study card

Shass Gift & Promotions

Driving Search & Local Market Dominance for a Corporate Gifting Brand

#1
Ranking for “corporate gifts USB sticks”
5,581
GMB impressions at monthly peak
175
Monthly conversions at peak
4,331
Backlinks across 402 referring domains
Read the case study
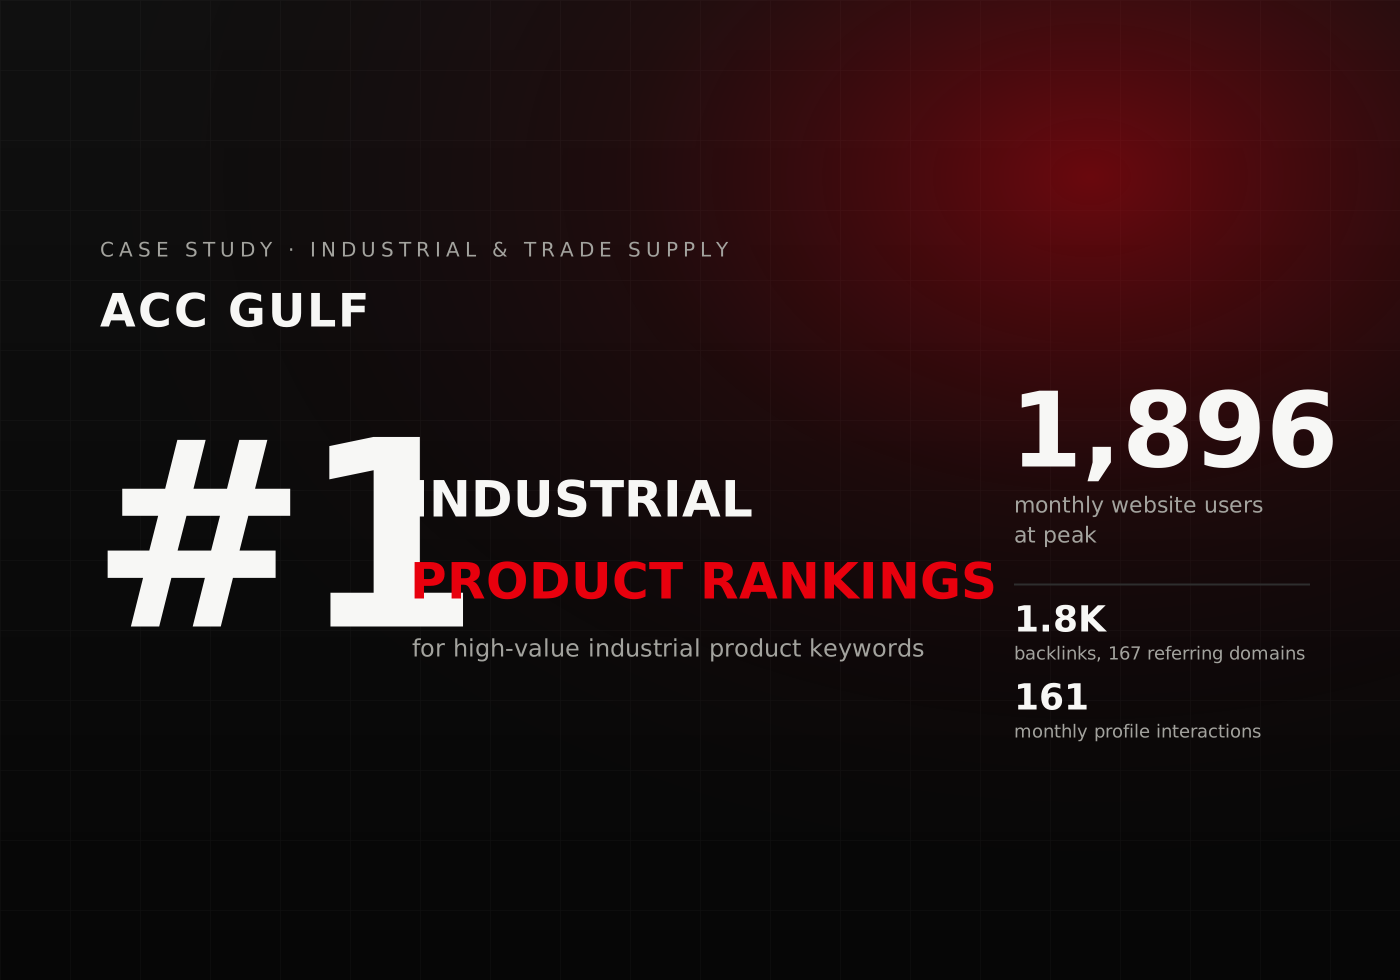
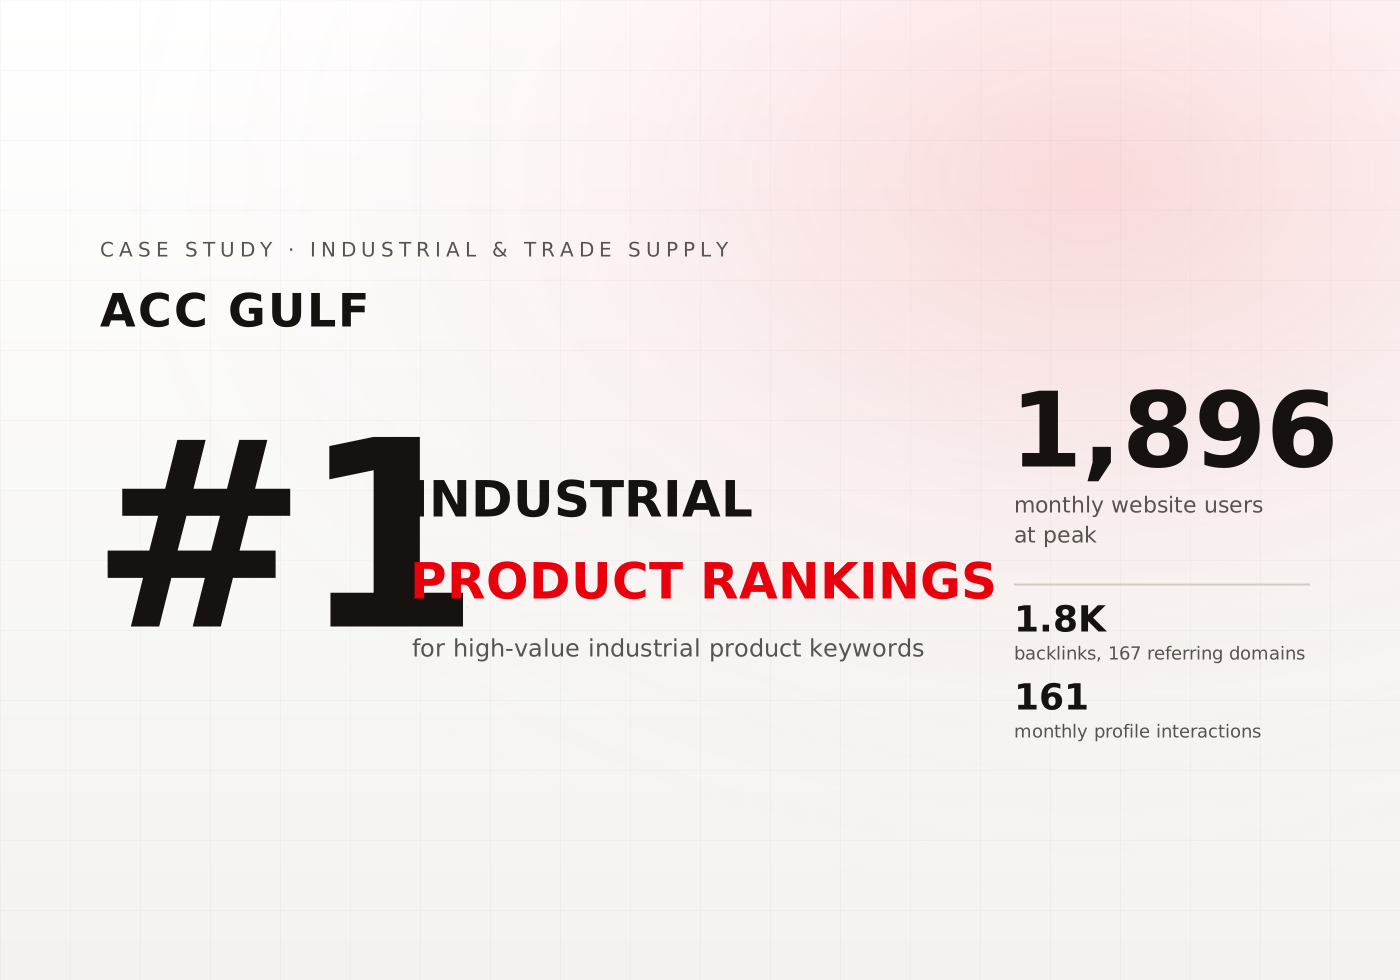
ACC Gulf case study cardACC Gulf case study card

ACC Gulf

Strengthening Search Authority & Local Lead Growth in Industrial Supply

#1
Ranking for high-value industrial product keywords
1,896
Monthly users at peak traffic
1.8K
Backlinks across 167 referring domains
161
Monthly Google My Business interactions
Read the case study
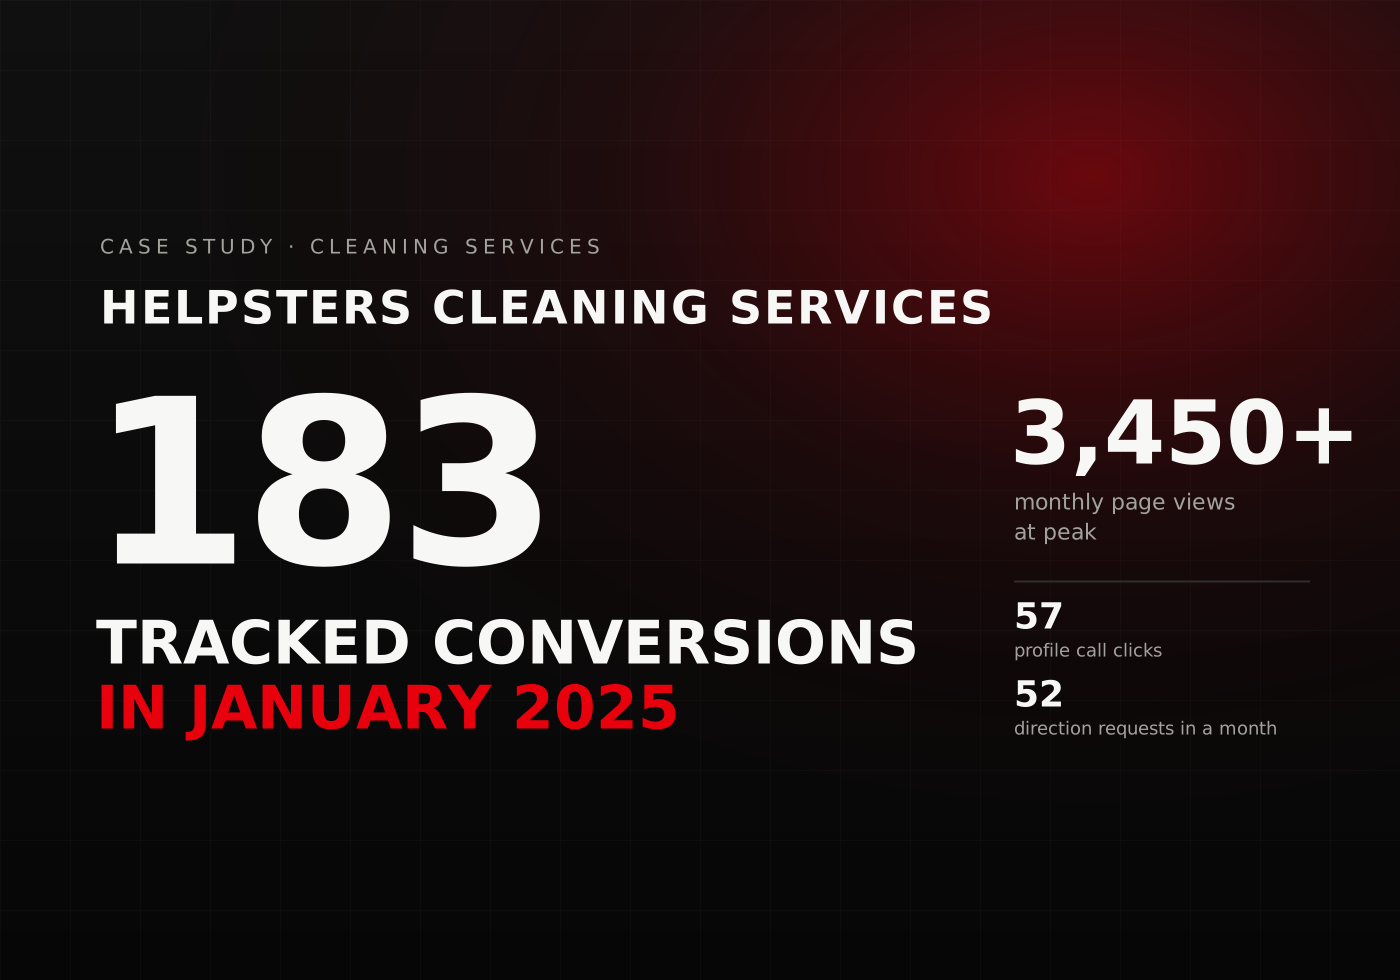
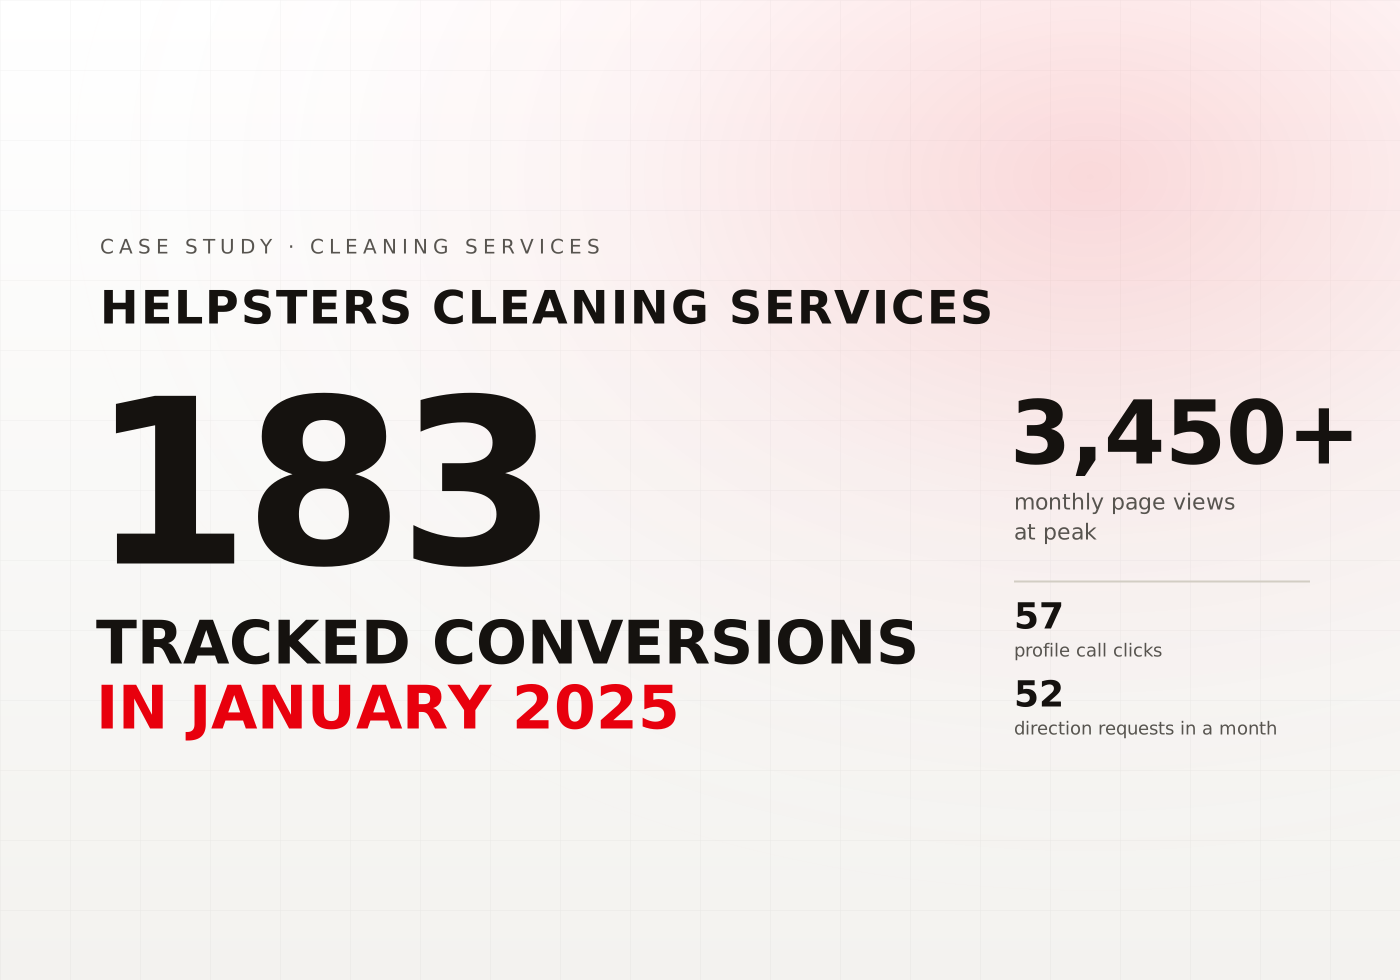
Helpsters Cleaning Services case study cardHelpsters Cleaning Services case study card

Helpsters Cleaning Services

Capturing High-Value Cleaning Contracts Through Targeted SEO

#1
Ranking for event & exhibition cleaning keywords
183
Monthly tracked conversions (Jan 2025)
3,450+
Monthly page views at peak
57
Monthly GMB call clicks
Read the case study
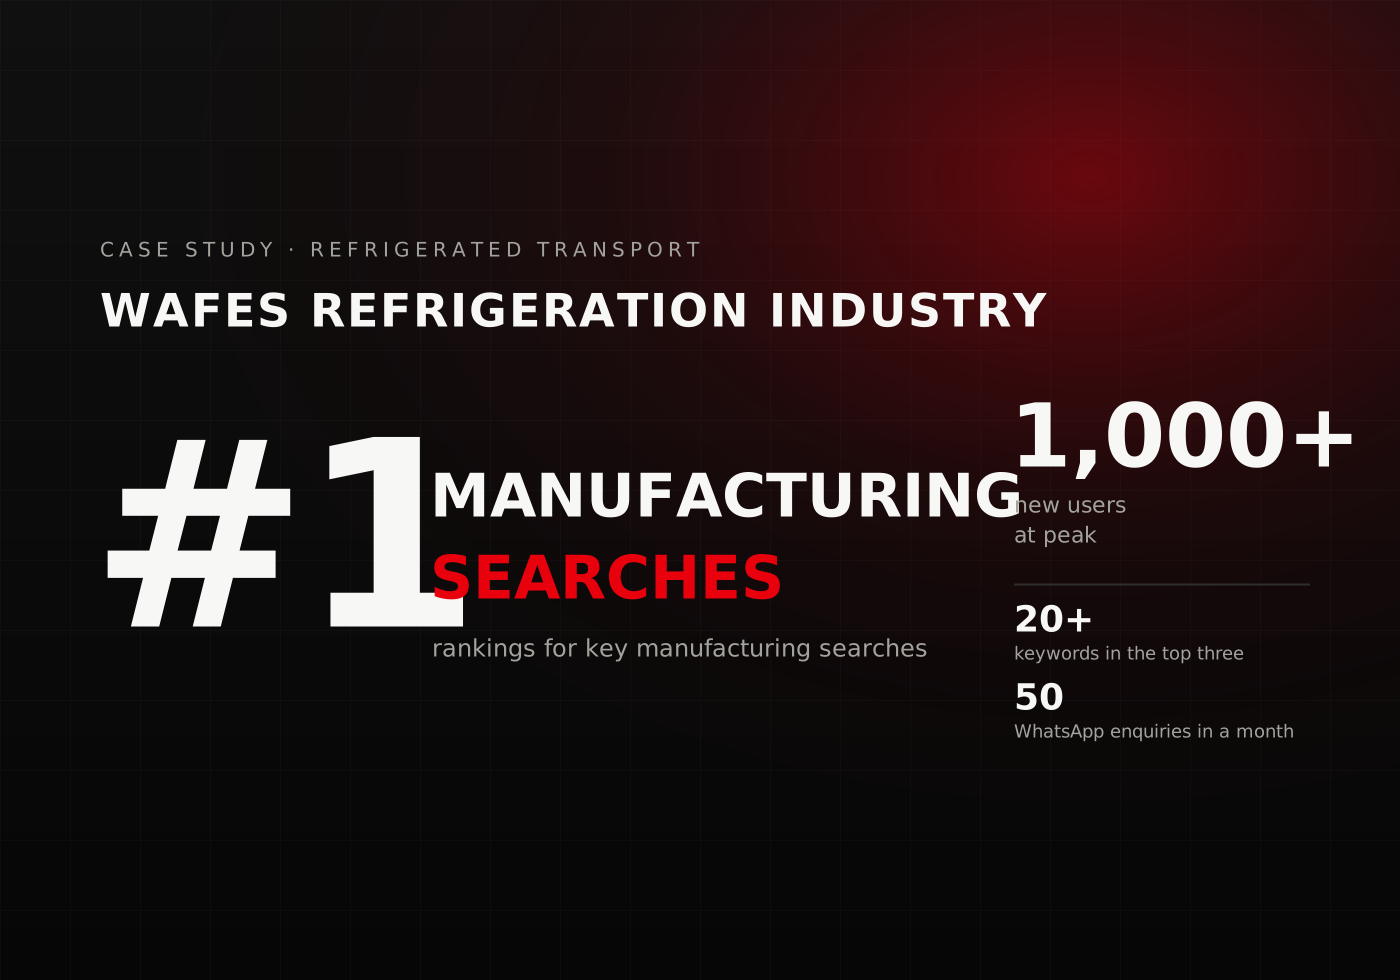
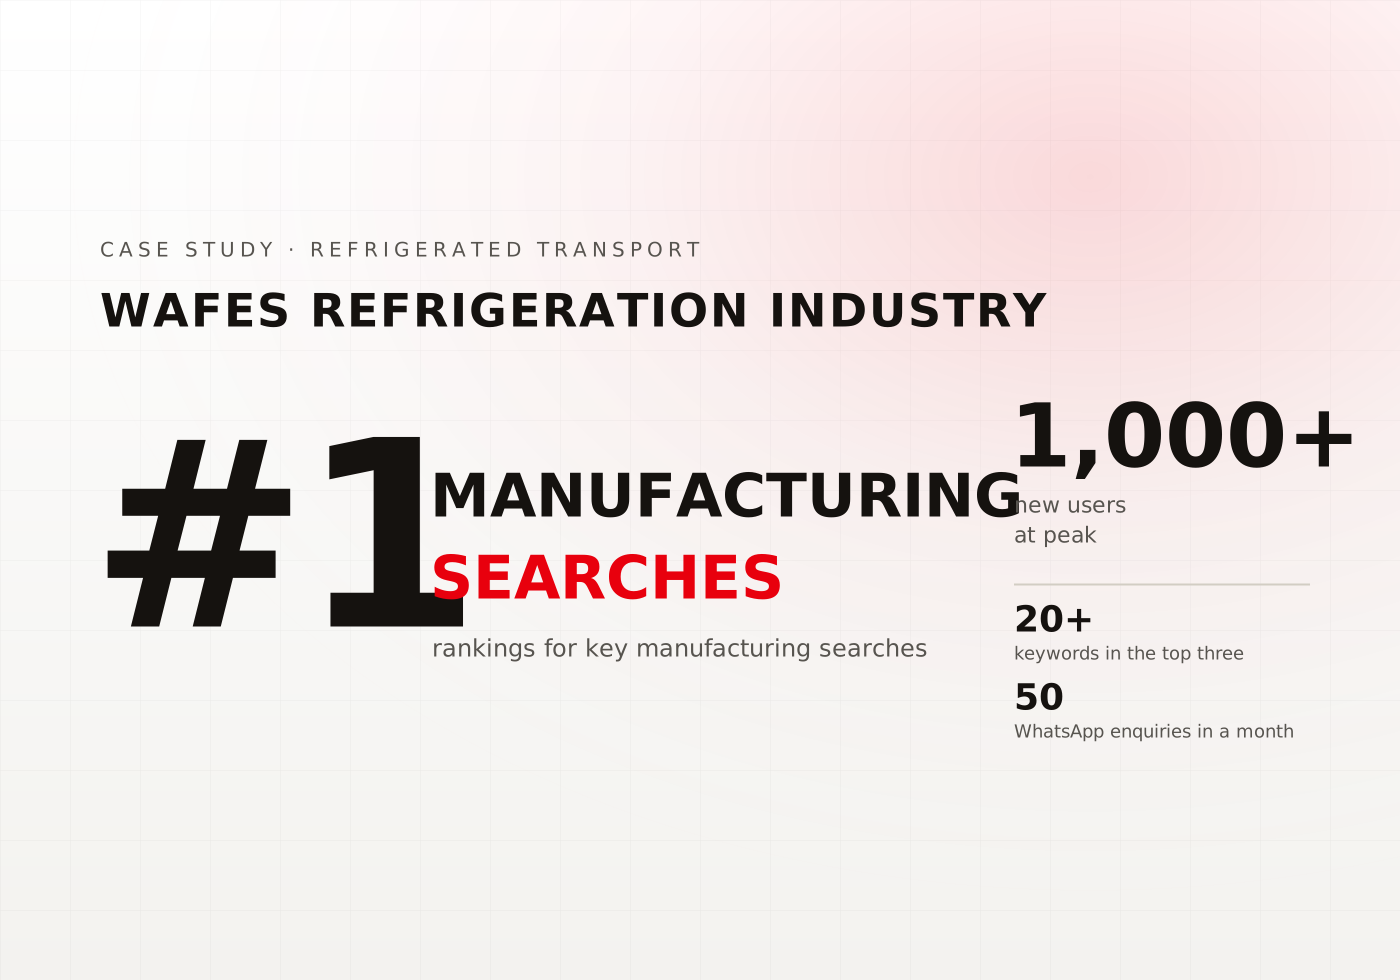
Wafes Refrigeration Industry case study cardWafes Refrigeration Industry case study card

Wafes Refrigeration Industry

Transforming Digital Visibility for a Refrigeration Manufacturer

#1
Ranking for core refrigeration manufacturing keywords
20+
Top 3 keyword positions secured
1,000+
New users at peak traffic
50
Monthly WhatsApp enquiries at peak
Read the case study
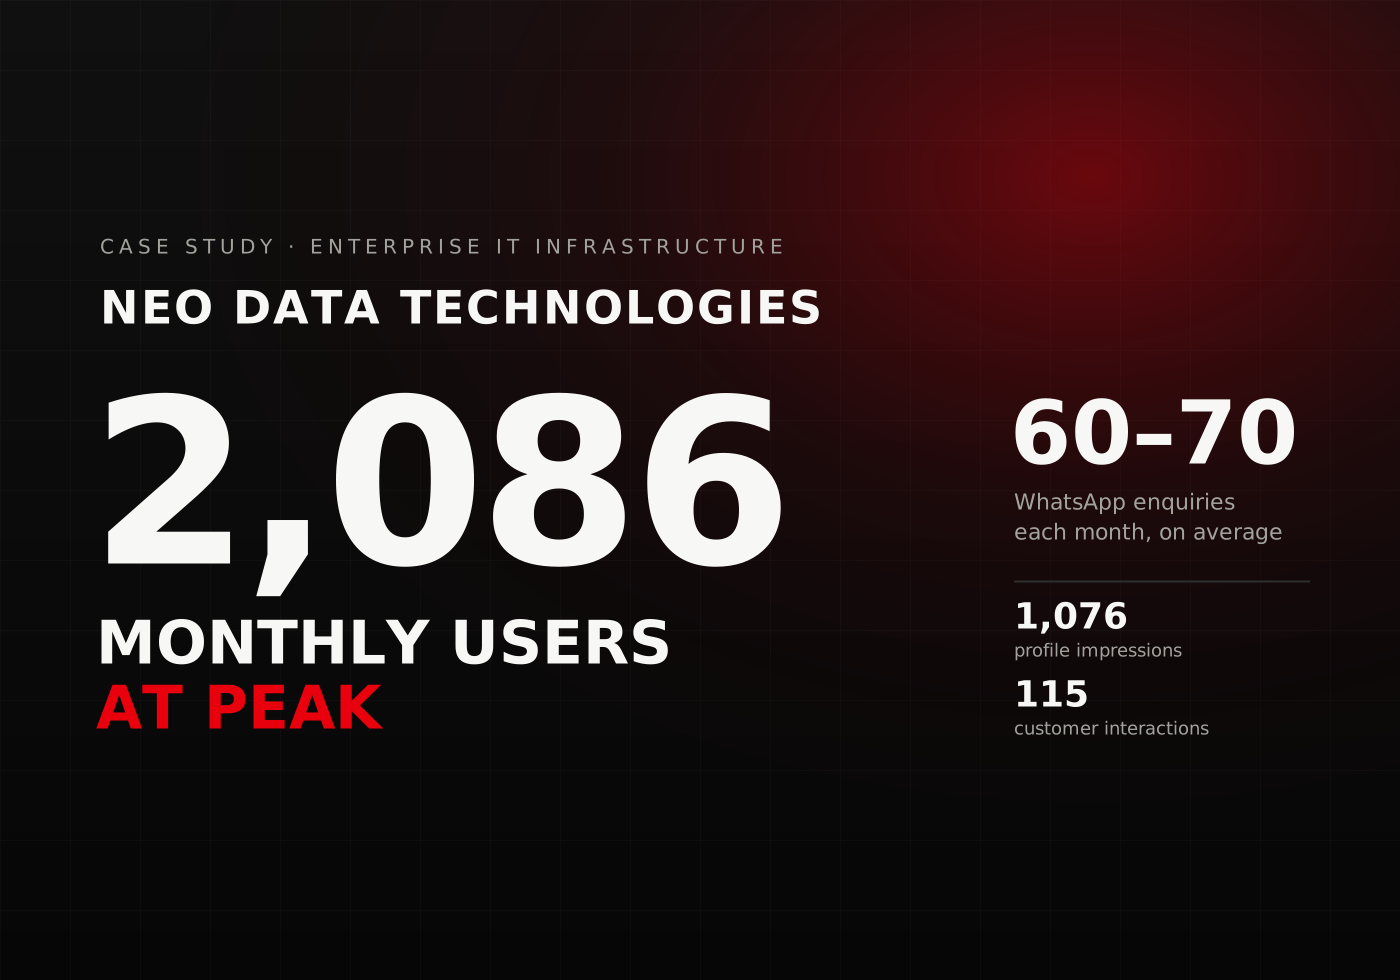
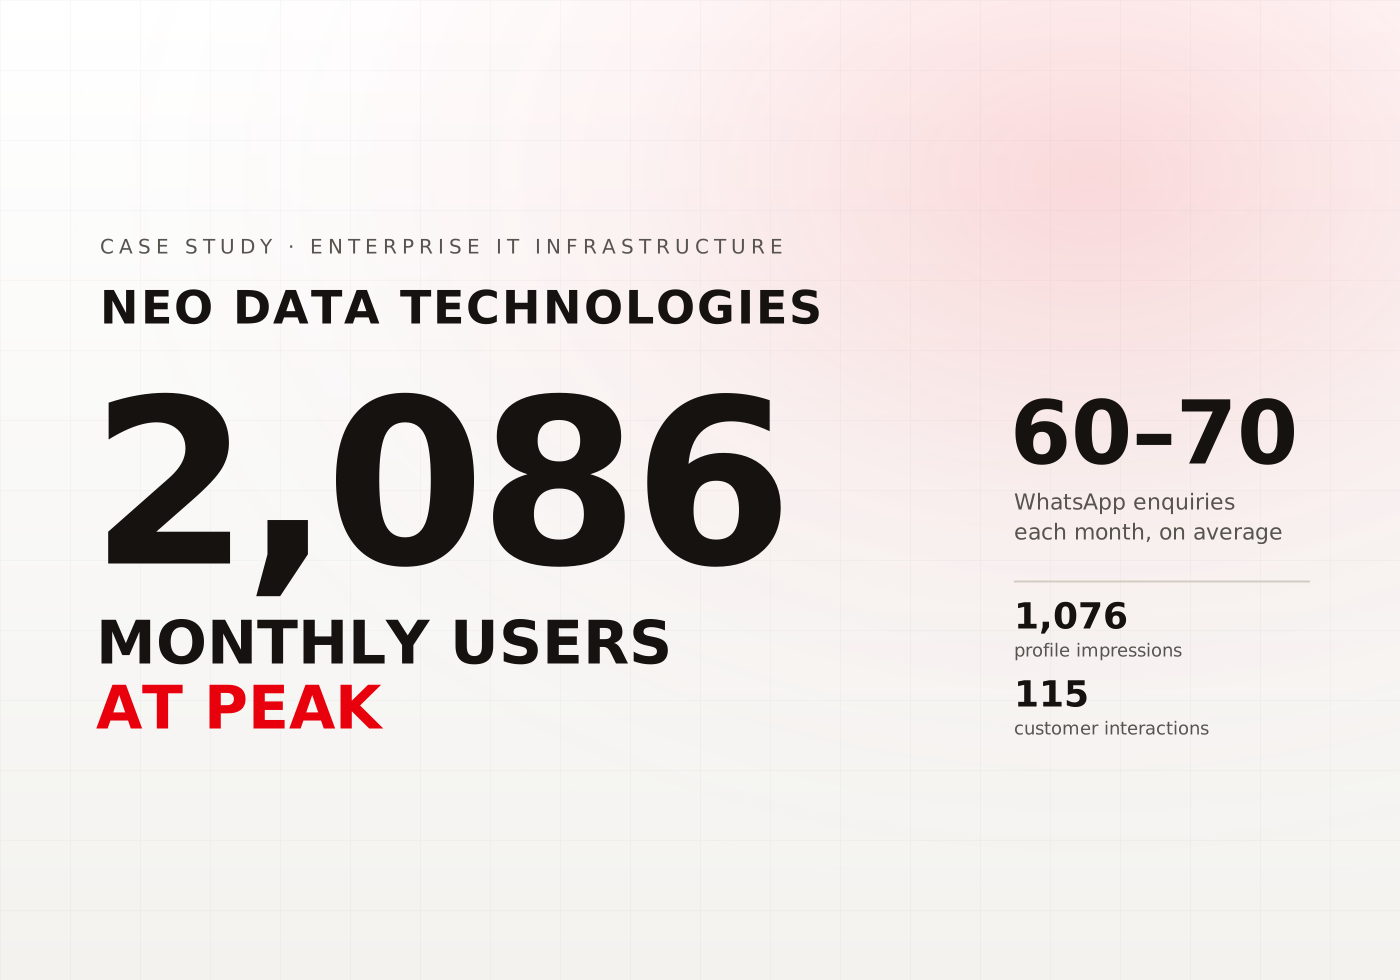
Neo Data Technologies case study cardNeo Data Technologies case study card

Neo Data Technologies

Expanding Search Visibility & Lead Growth for an Enterprise IT Distributor

#1
Ranking for “DellEMC distributors in Dubai”
2,086
Monthly users at peak traffic
1,076
Google My Business impressions
60–70
Average monthly WhatsApp enquiries
Read the case study
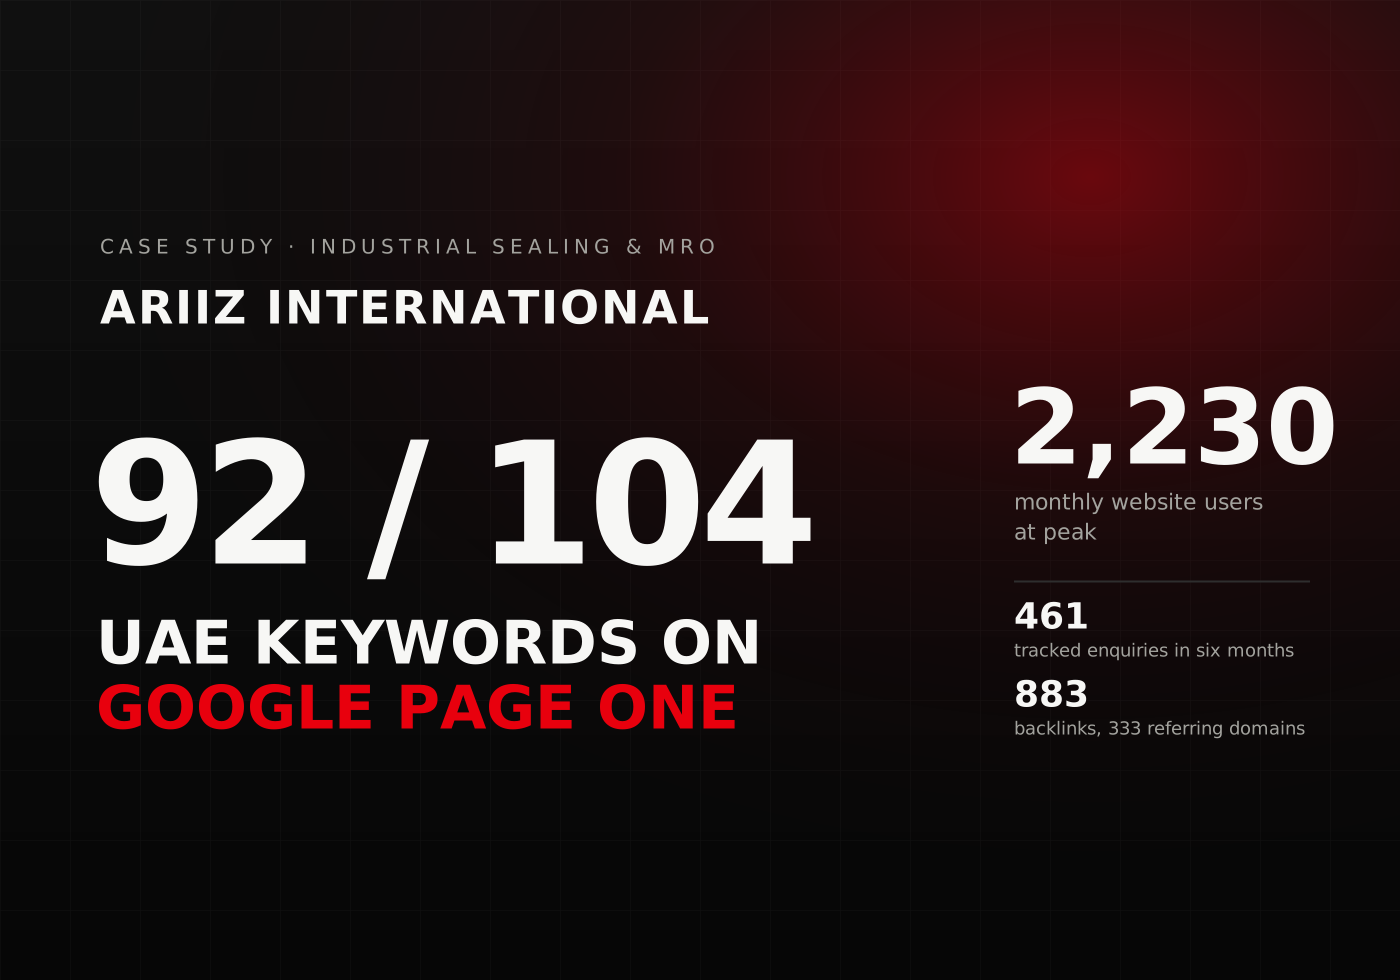
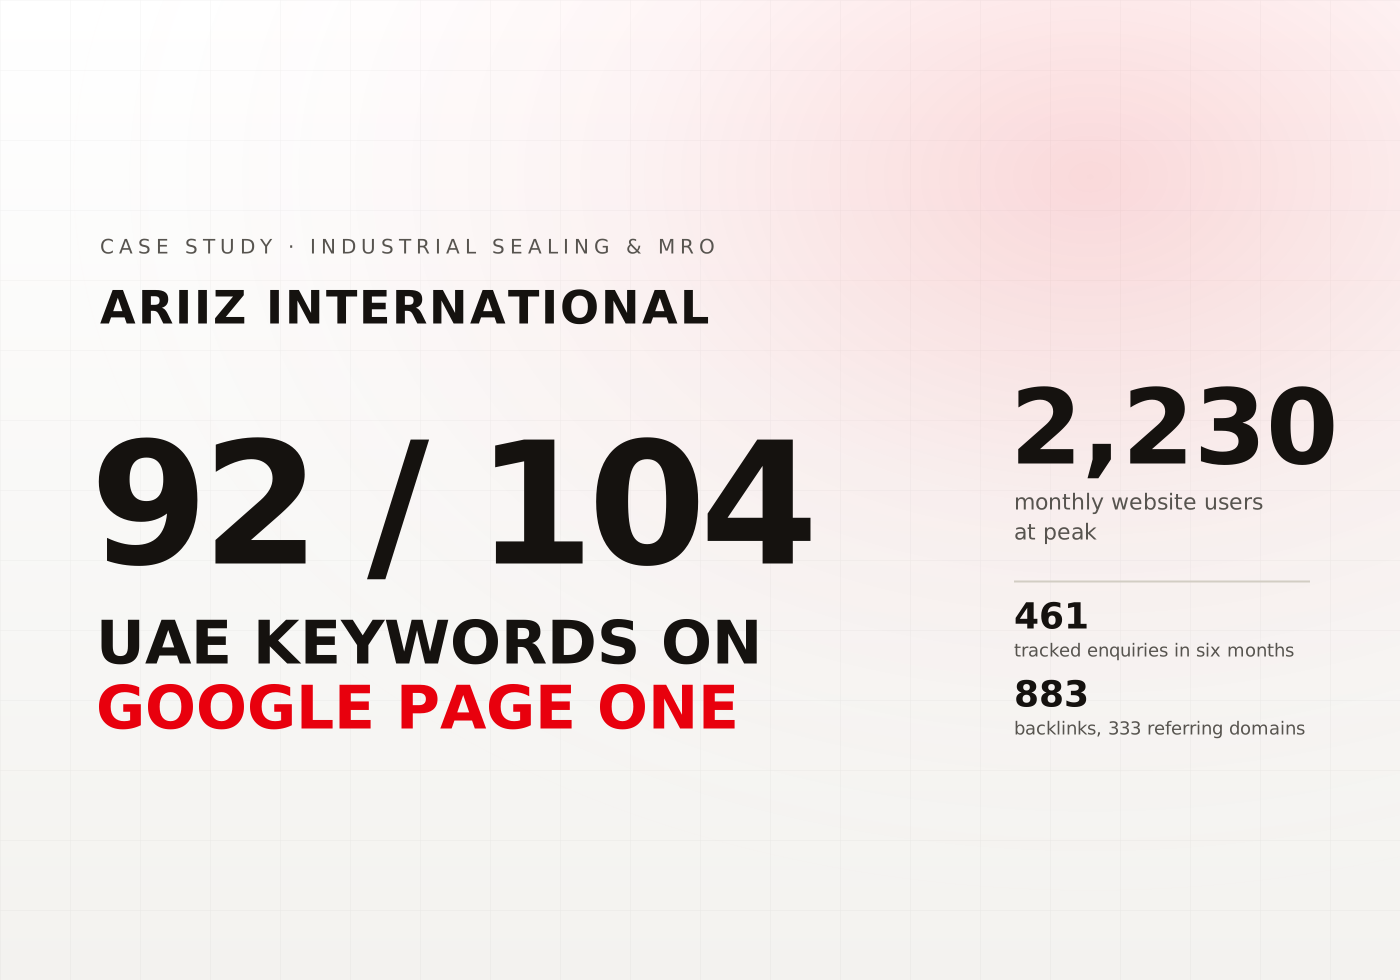
Ariiz International case study cardAriiz International case study card

Ariiz International

Driving High-Intent Search Growth for an Industrial Sealing Supplier

#1
Ranking for high-value industrial sealing keywords
1,700+
Monthly website users at peak
550+
Backlinks supporting domain authority
75+
WhatsApp enquiries in a single month
Read the case study
Onyx General Contracting case study cardOnyx General Contracting case study card

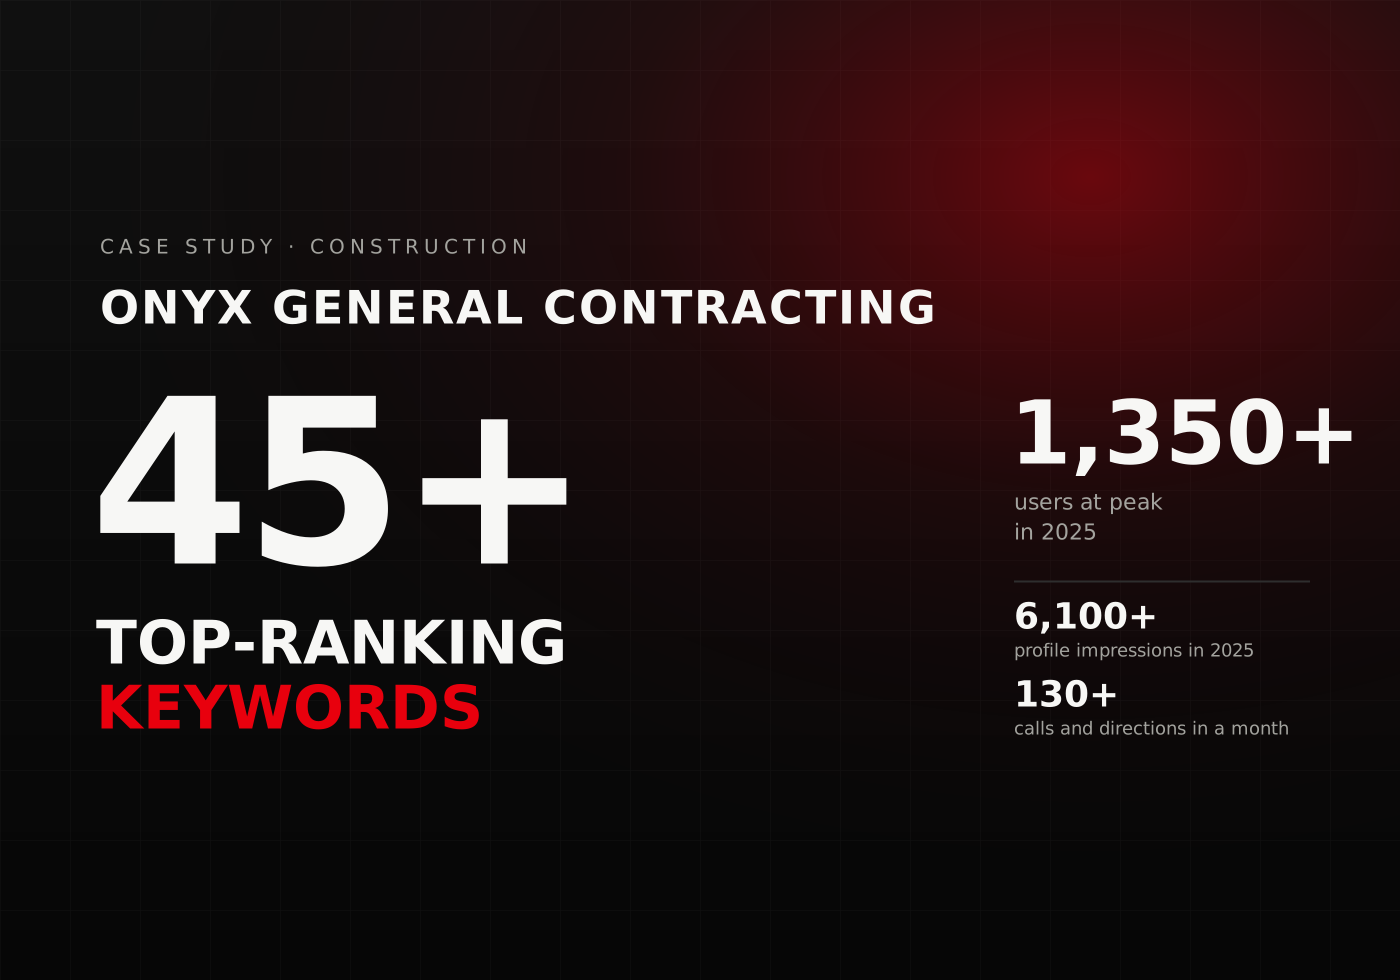
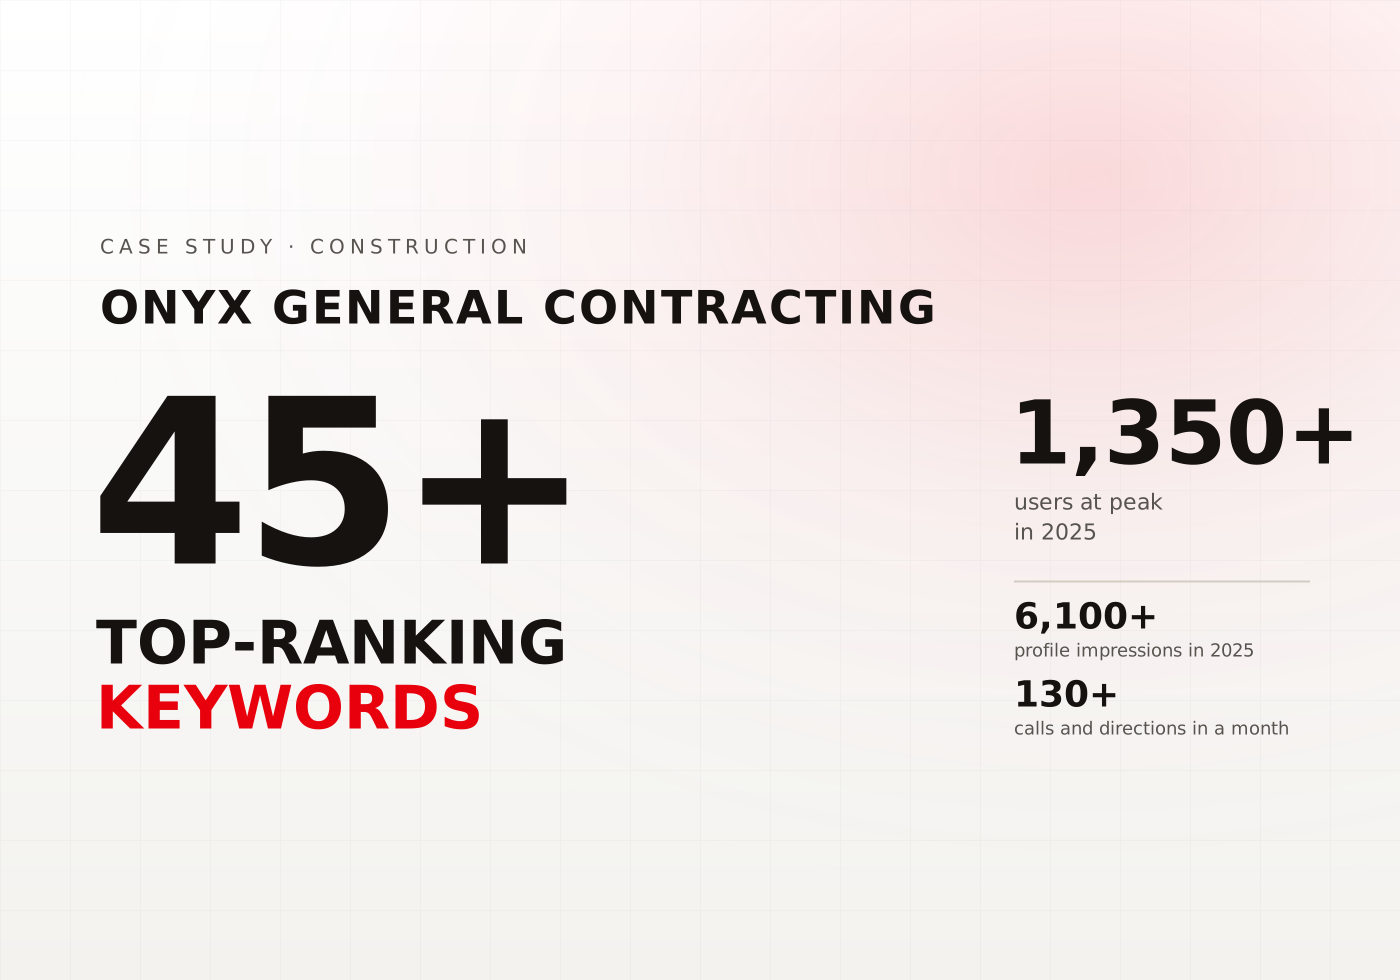
Onyx General Contracting

Achieving Digital Dominance with 1,350+ Monthly Users and 6,100+ GMB Impressions

1,350+
Peak organic traffic volume in 2025
70%
Average user engagement rate maintained
6,100+
Google My Business impressions generated in 2025
45+
Top ranking keywords across competitive construction verticals
Read the case study
DGR Aviation Training Services case study cardDGR Aviation Training Services case study card

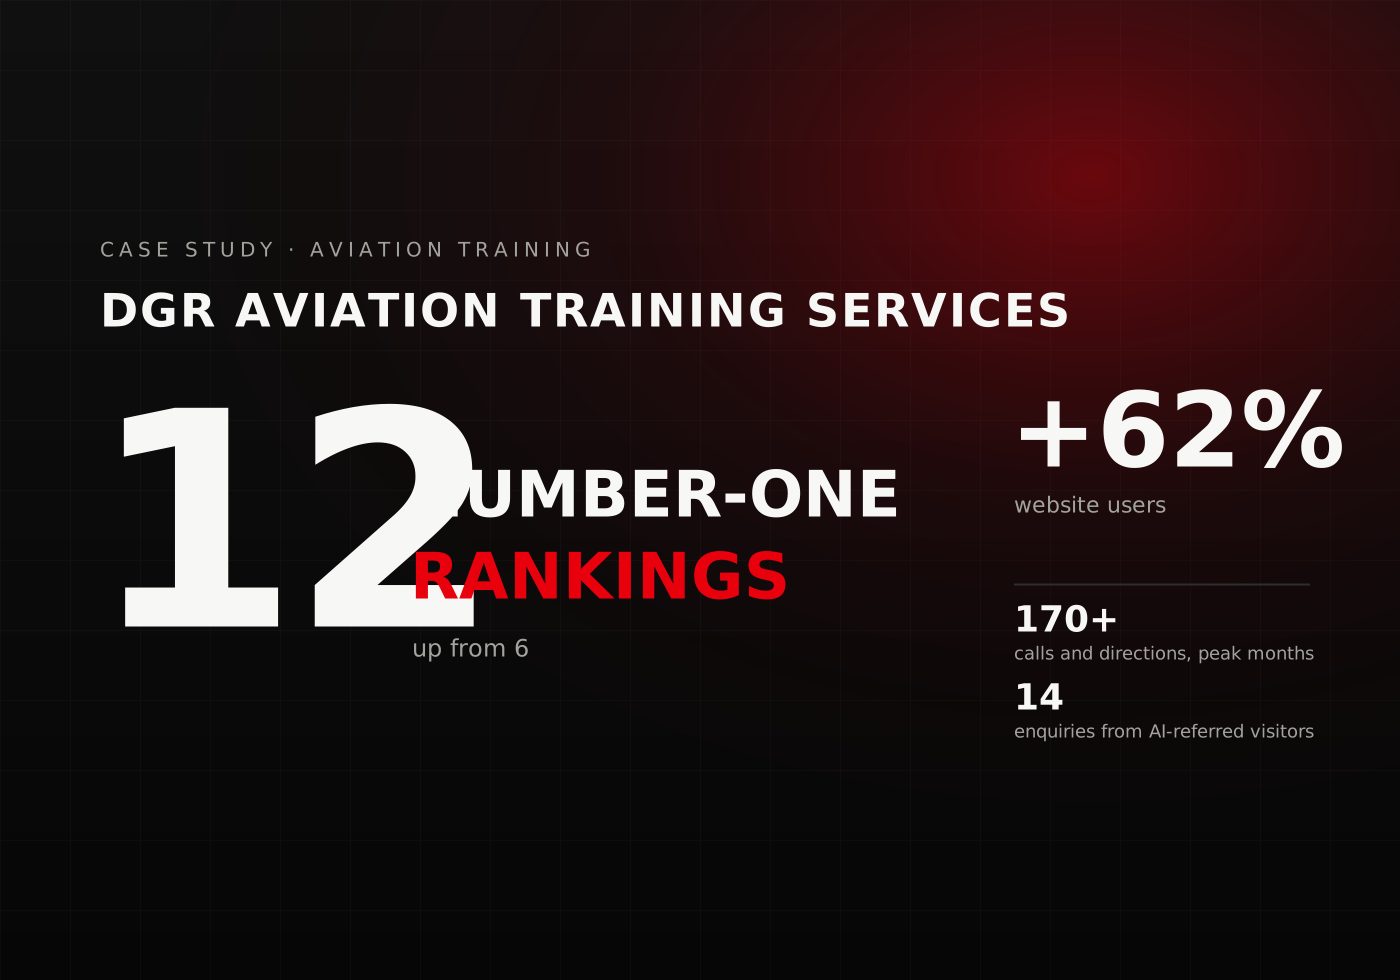
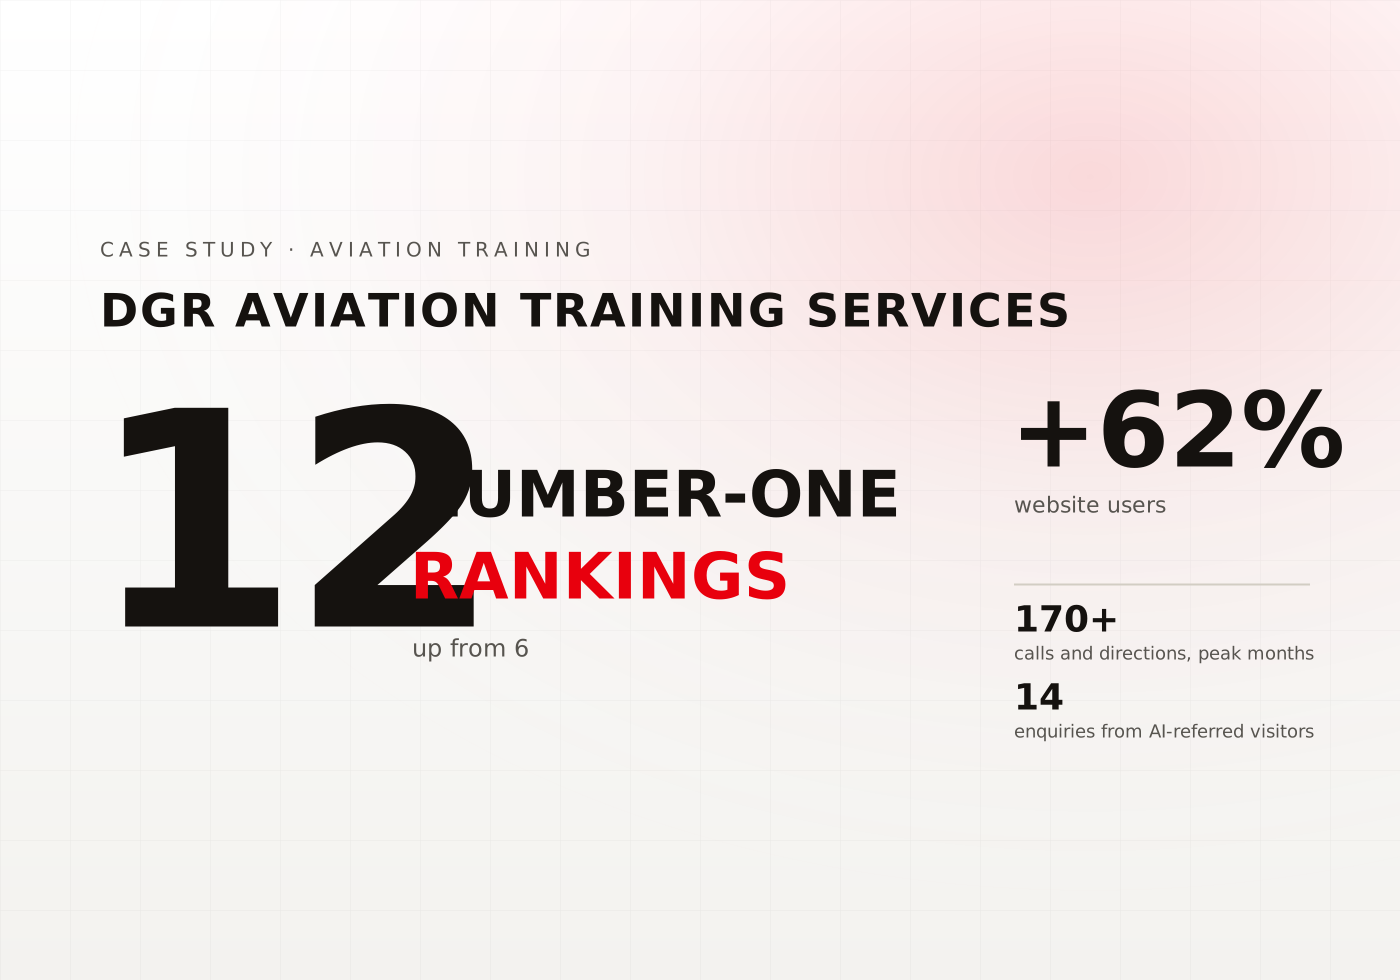
DGR Aviation Training Services

Driving High-Intent Visibility for Aviation Compliance Training

#1
Ranking for DGR Training Dubai & Dangerous Goods Training Dubai
1,600+
Google My Business impressions in a single month
170+
Local actions (calls & direction requests) in peak months
1,000+
Monthly website users driven by high-intent searches
Read the case study
Masterkraft case study cardMasterkraft case study card

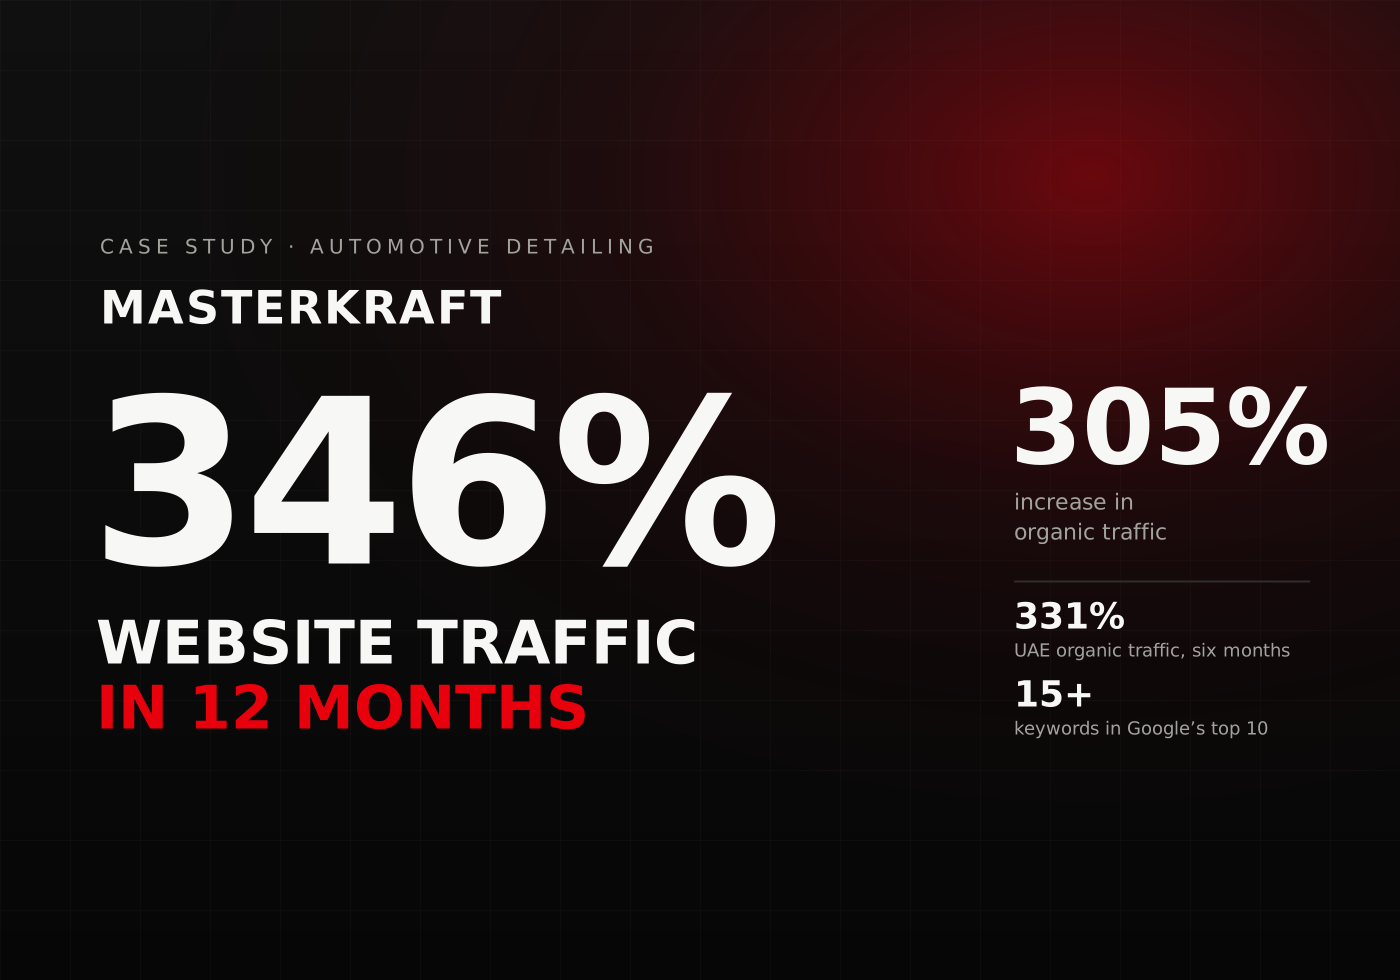
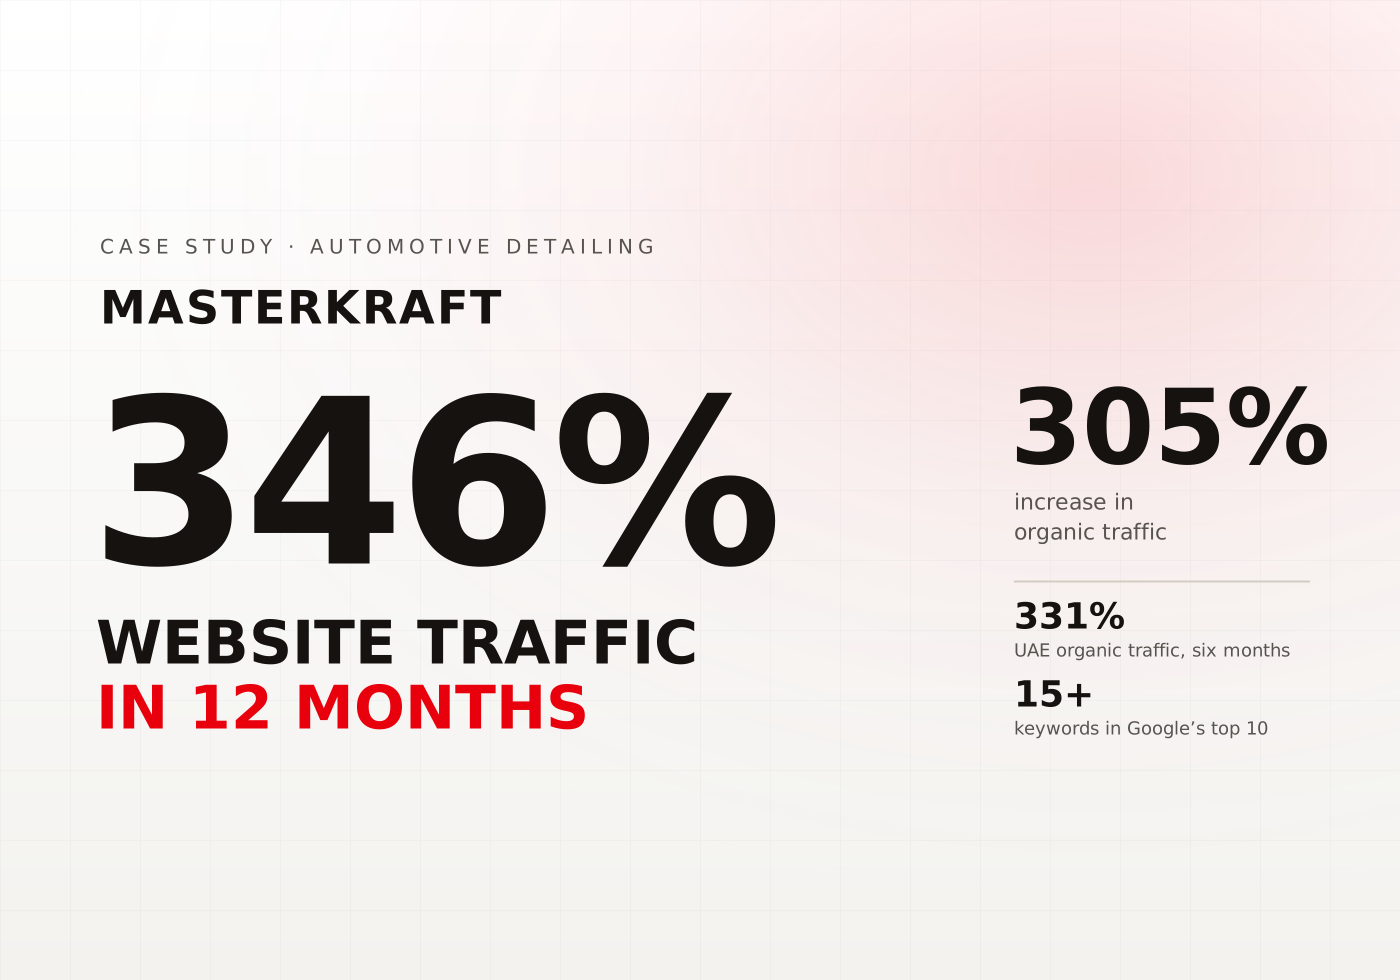
Masterkraft

Driving Digital Growth with a 346% Increase in Website Traffic

346%
Increase in website traffic over the first 12 months
305%
Increase in organic traffic over the first 12 months
331%
Increase in UAE-based organic traffic over the last 6 months
15+
keywords ranking in the top 10 on SERPs in the first 6 months
Read the case study
Ultracare case study cardUltracare case study card

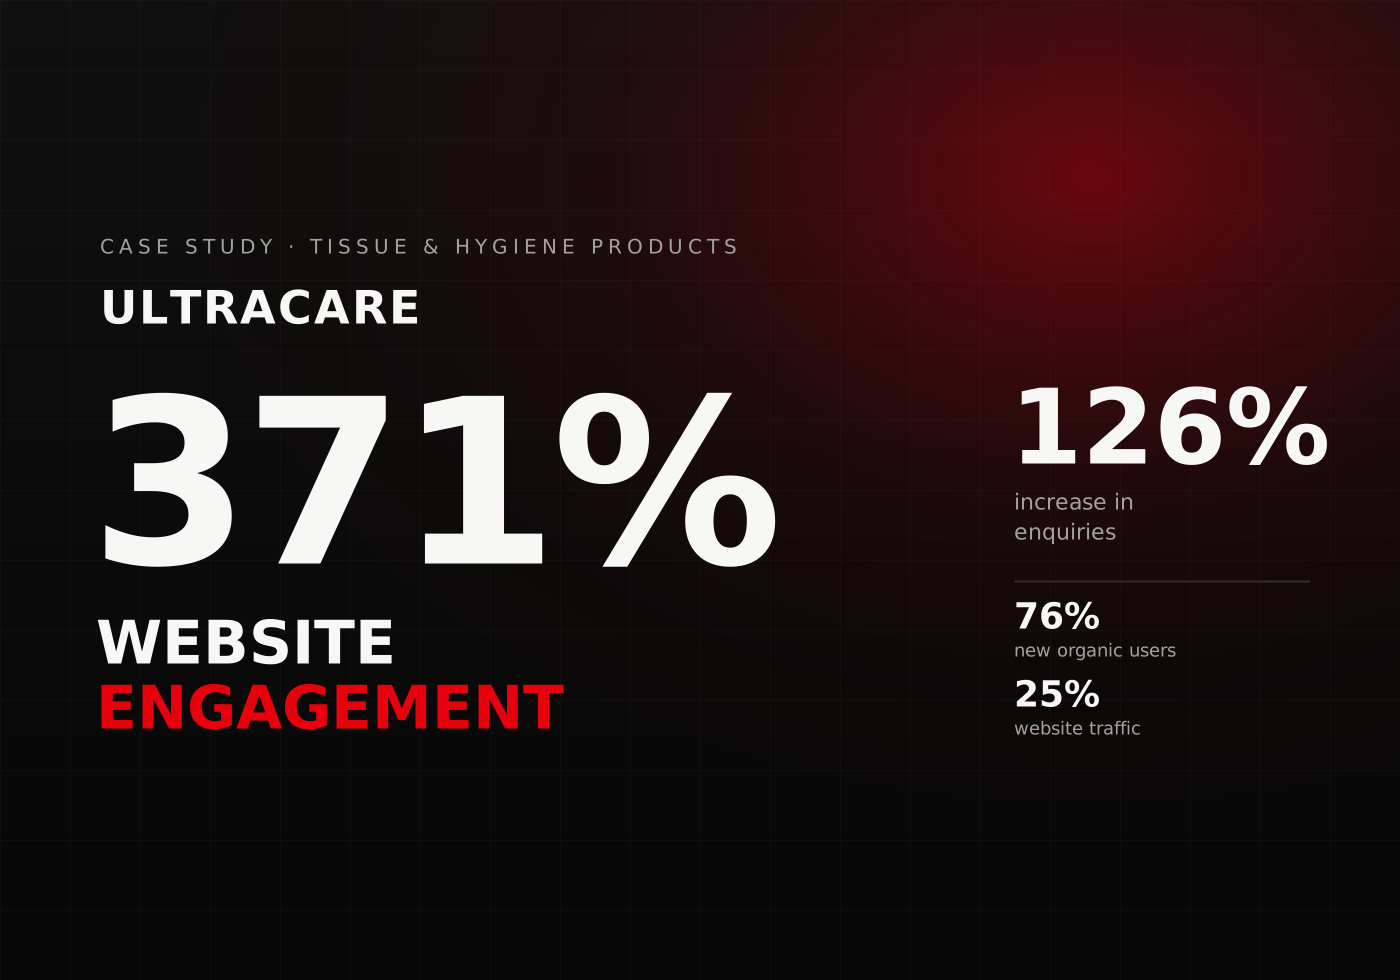
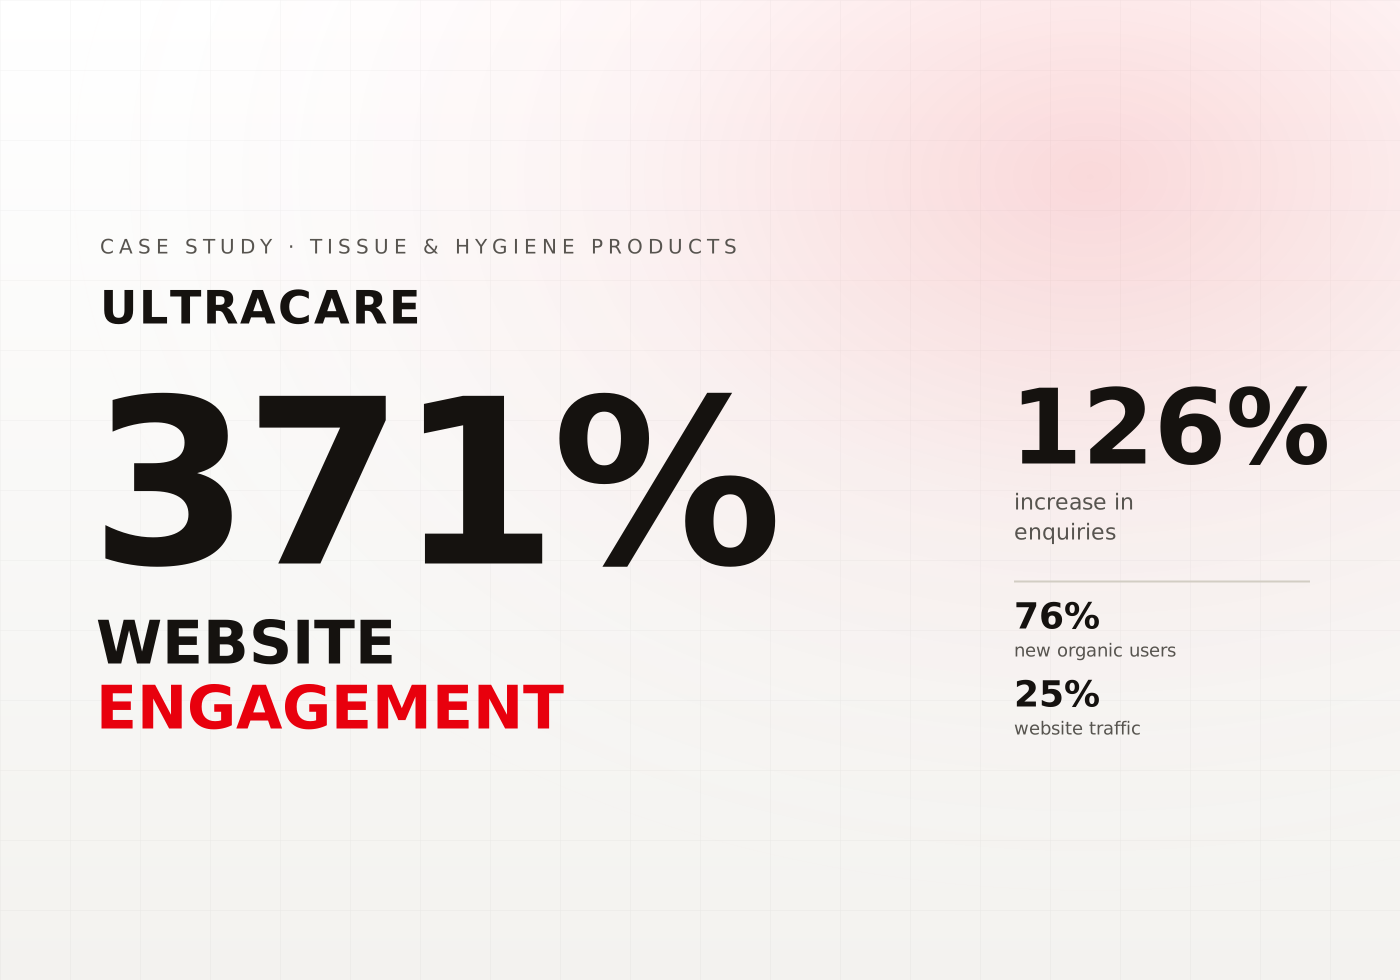
Ultracare

Elevating Engagement - A 371% Boost in Website Interactions

25%
Increase in website traffic year on year over the first 12 months
76%
Increase in new users from organic traffic over the first 12 months
126%
Increase in the total number of incoming enquiries
371%
Increase in traffic engagements over the first 12 months
Read the case study
PKF UAE case study cardPKF UAE case study card

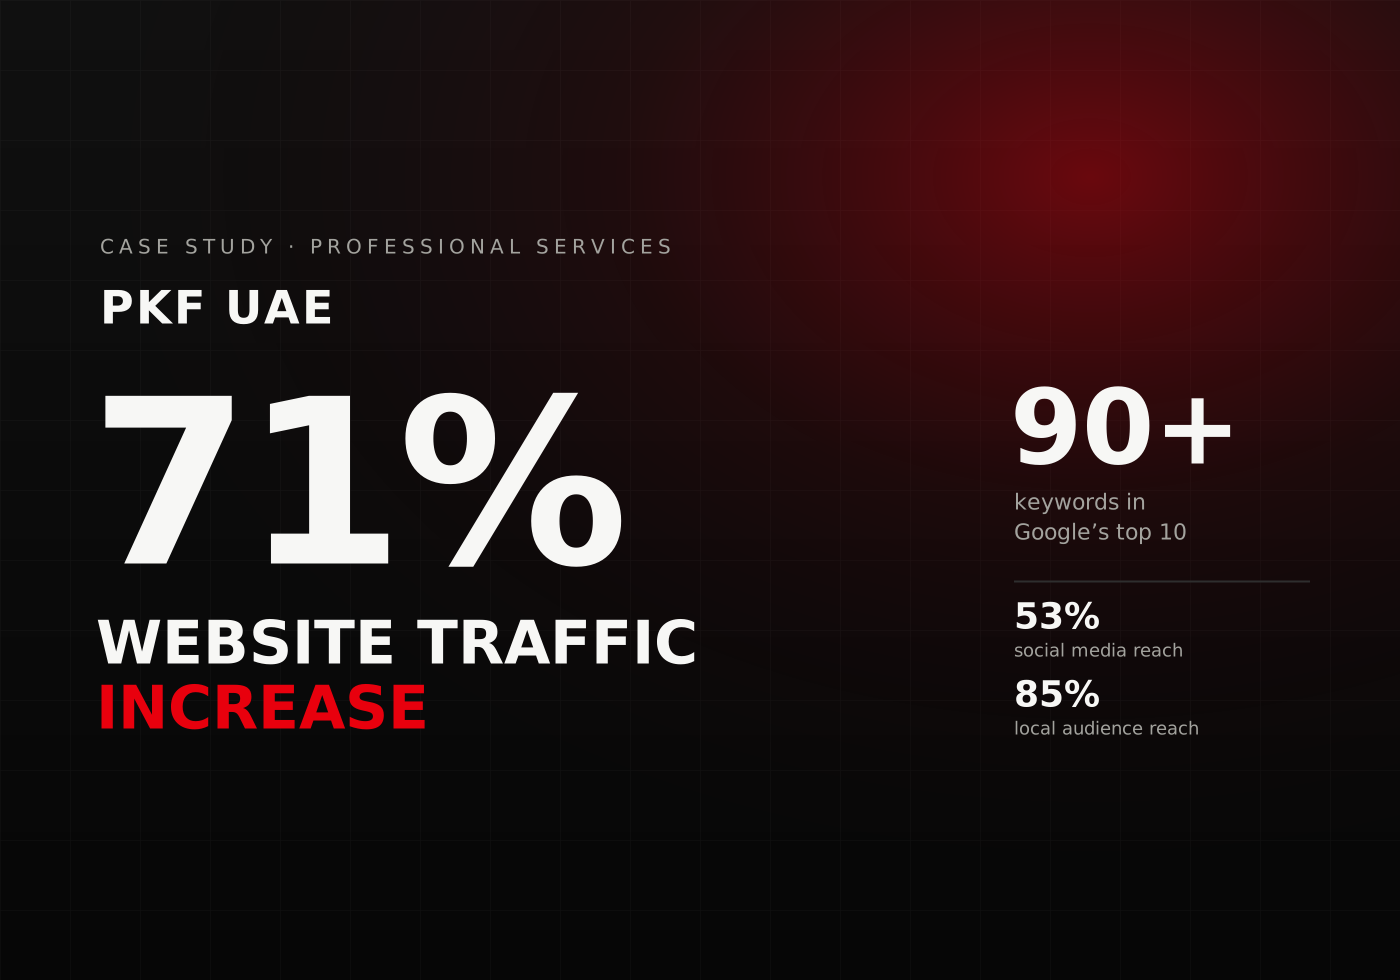
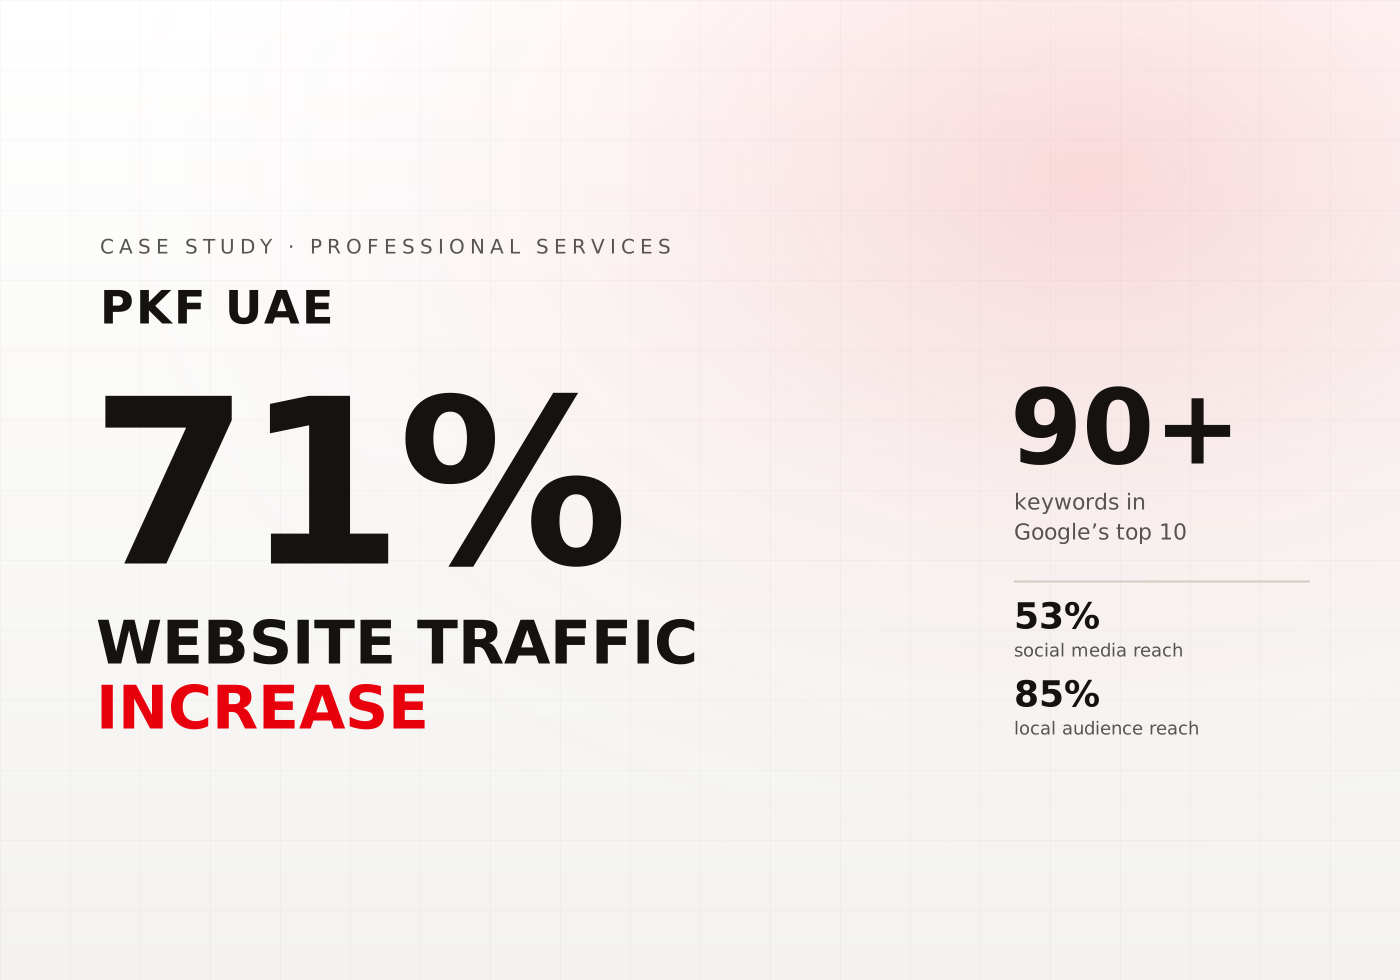
PKF UAE

Driving Success for PKF with 71% Traffic Surge

71%
Increase in website traffic year on year over the first 12 months
90+
Keywords ranking in the top 10 on SERPs in the first 12 months
53%
Increased social media reach across multiple channels over the first 12 months
85%
Increased local audience reach over the first 12 months
Read the case study
Autobahn Car Rental case study cardAutobahn Car Rental case study card

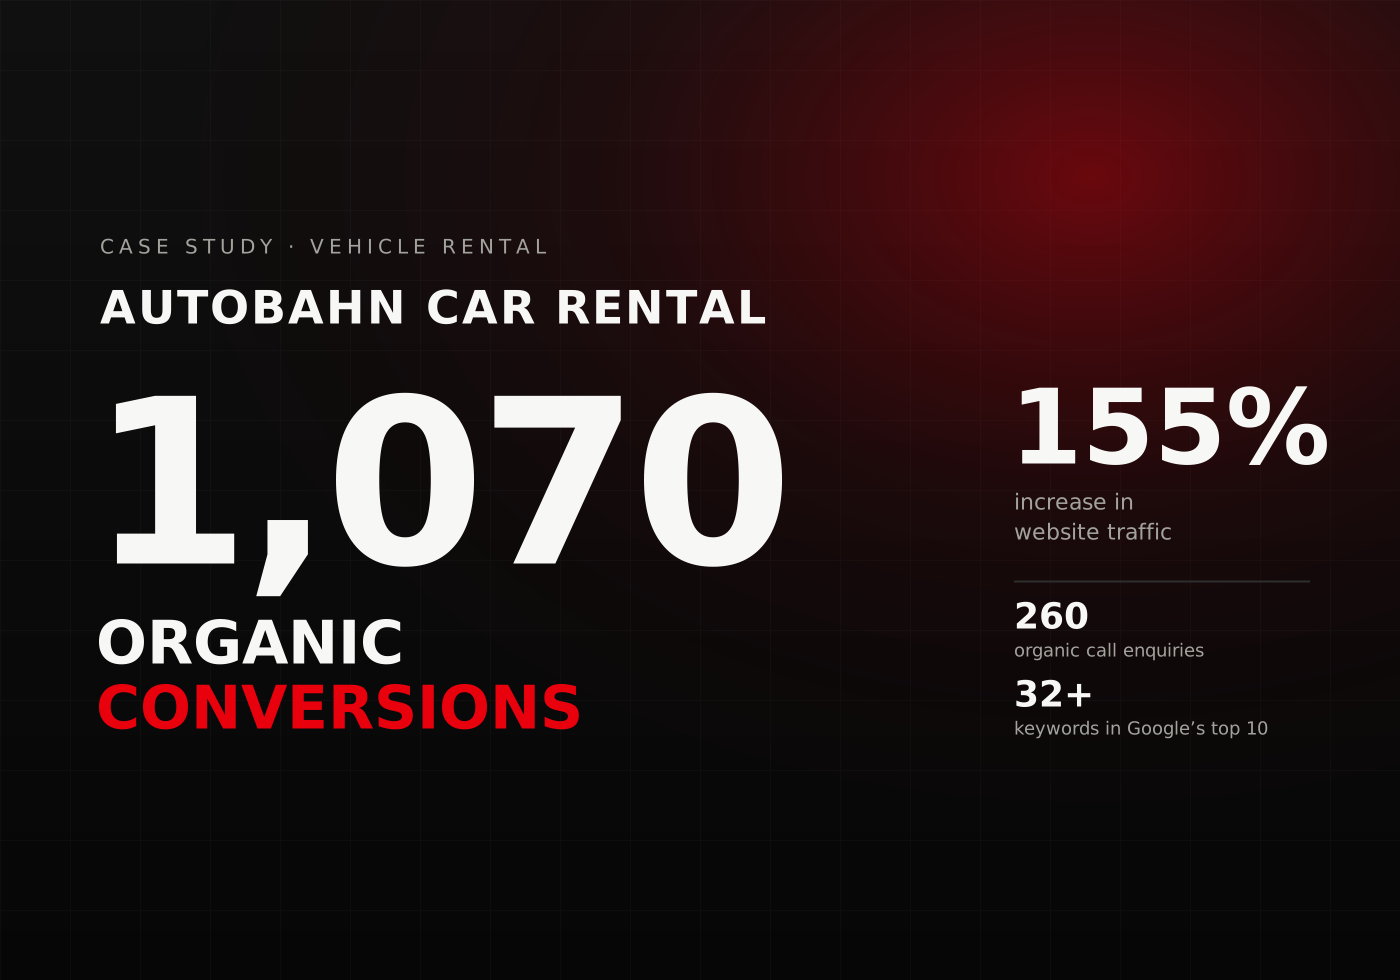
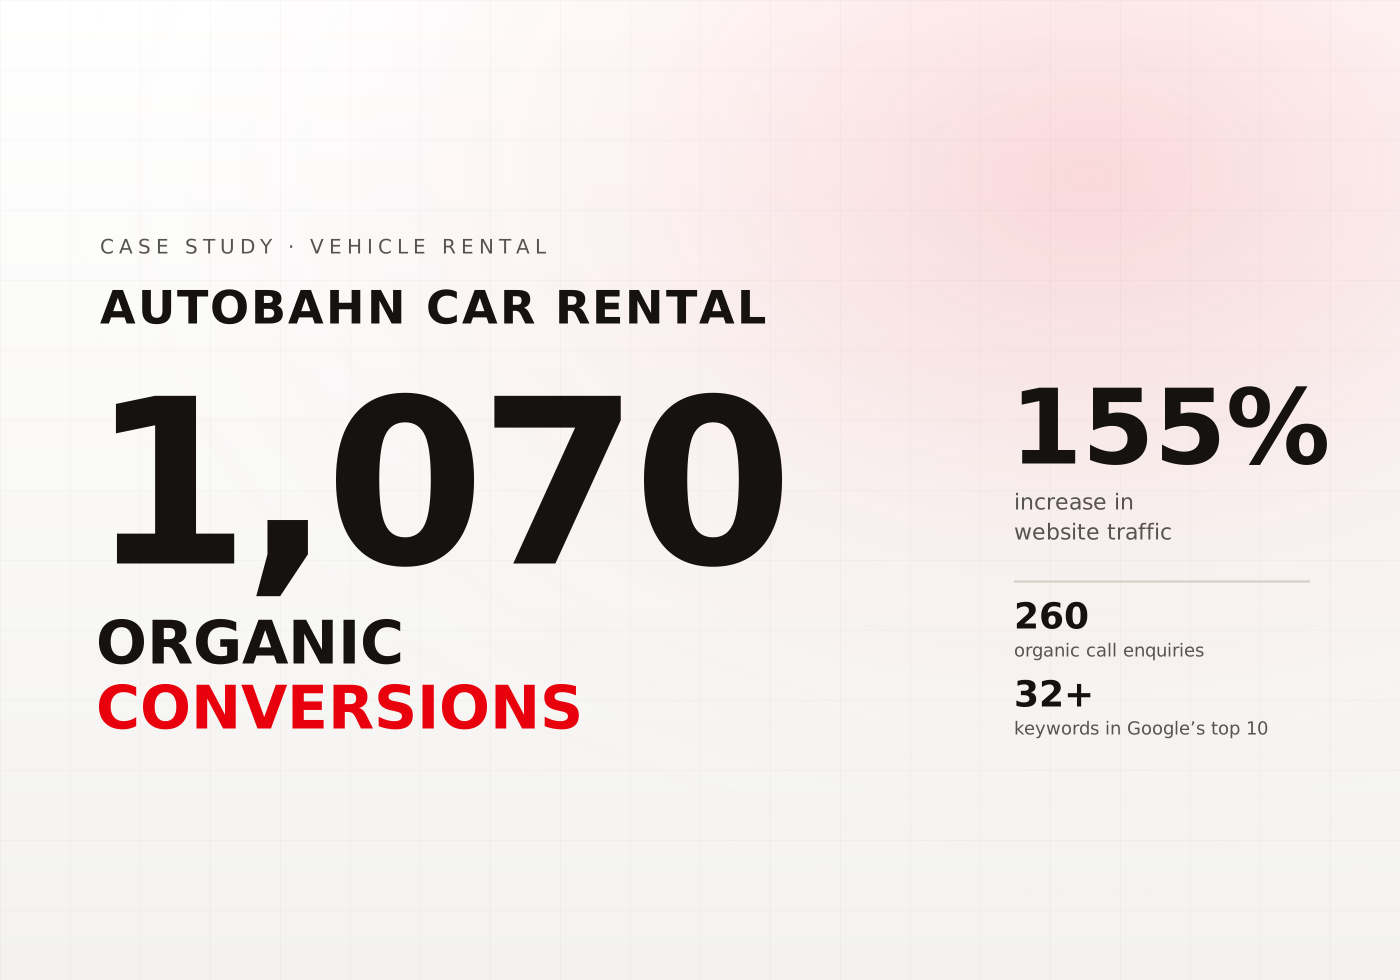
Autobahn Car Rental

Accelerating Success with a 155% Growth in Website Traffic

155%
Increase in website traffic year on year over the first 12 months
1070
Total number of organic conversions over the last 6 months
22%
Increase in UAE-based organic visitors over the last 6 months
260
Total number of organic call enquiries over the last 6 months
Read the case study
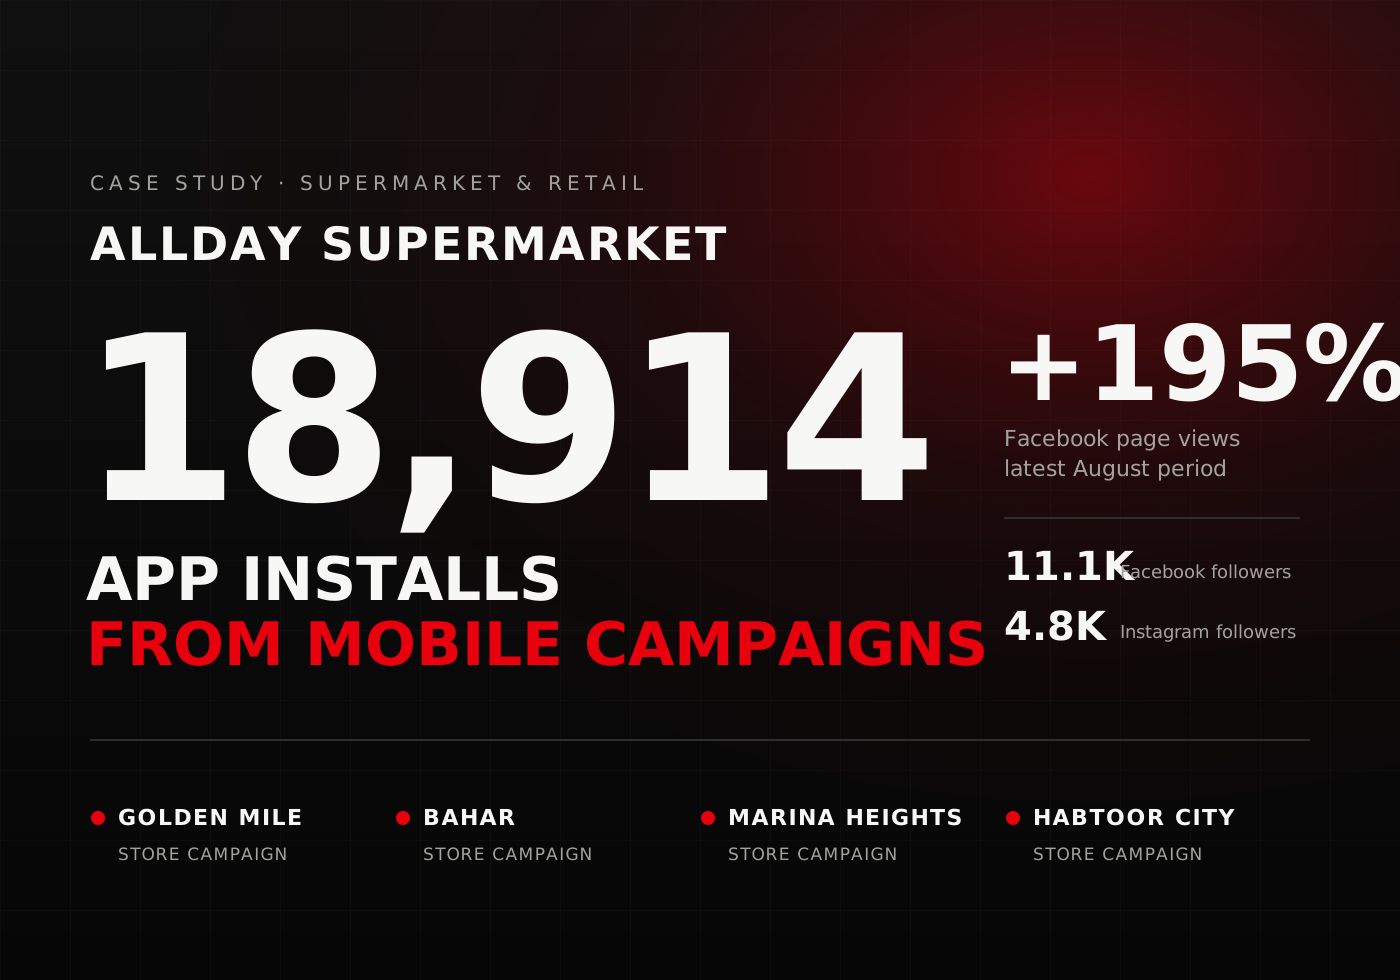
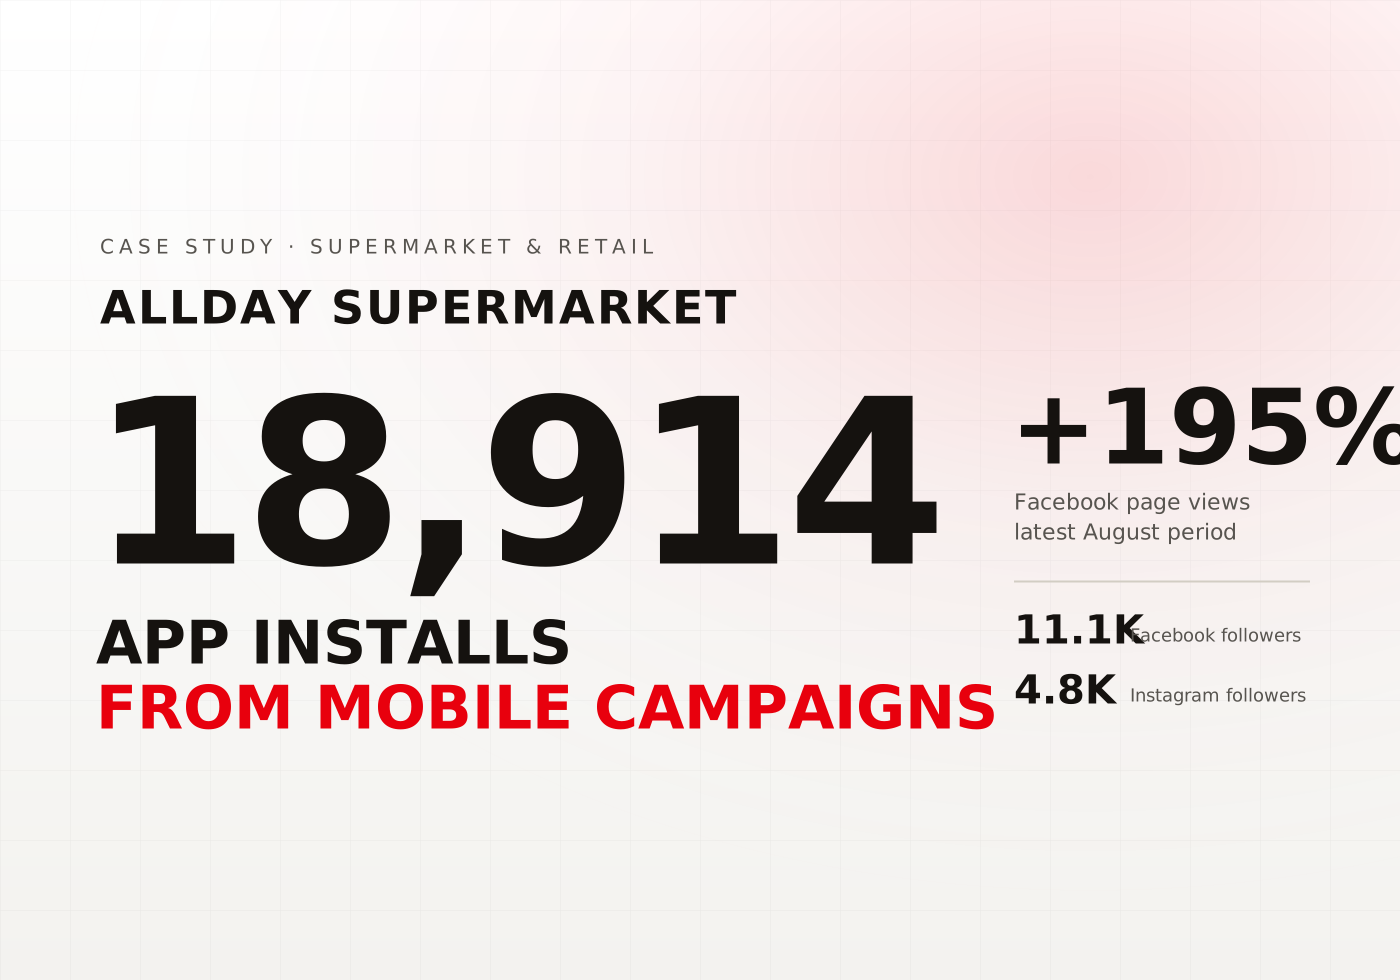
AllDay Supermarket case study cardAllDay Supermarket case study card

AllDay Supermarket

Incredible 64x Increase in Social Media Impressions for AllDay Supermarket

18,914
The total number of app installs generated
64x
More impressions on social media over the first 12 months
14x
More impressions in the following 12 months through campaign optimization
Read the case study
Datagram Store case study cardDatagram Store case study card

Datagram Store

Transforming the High-End IT Product E-Commerce Experience

+426%
Growth in total users
20+
High-intent keywords in Top 3
+60%
Increase in GMB call clicks
+36%
Growth in direct phone enquiries
Read the case study
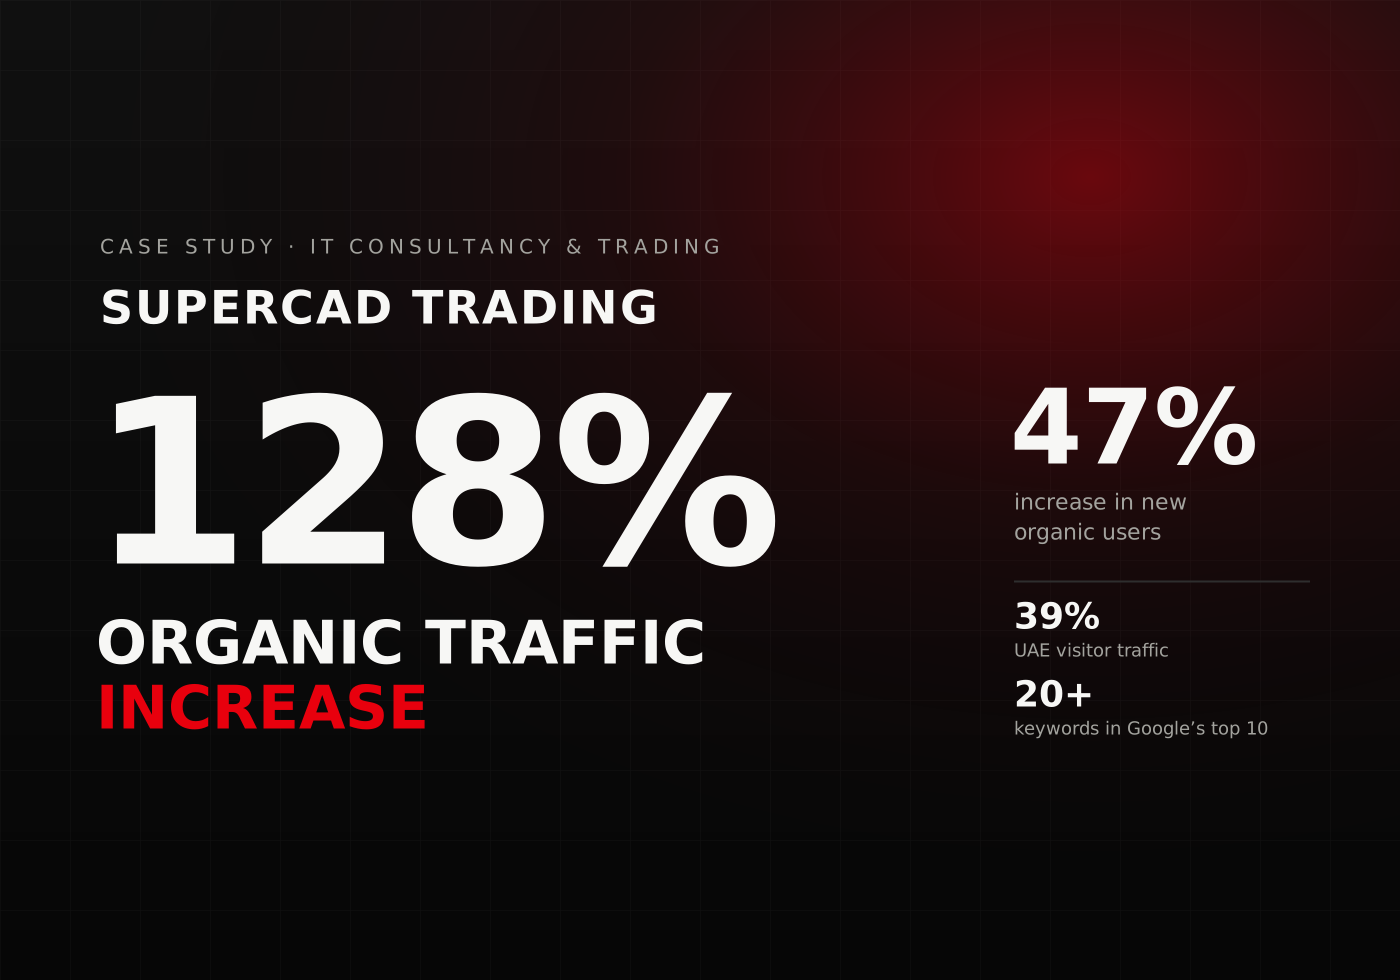
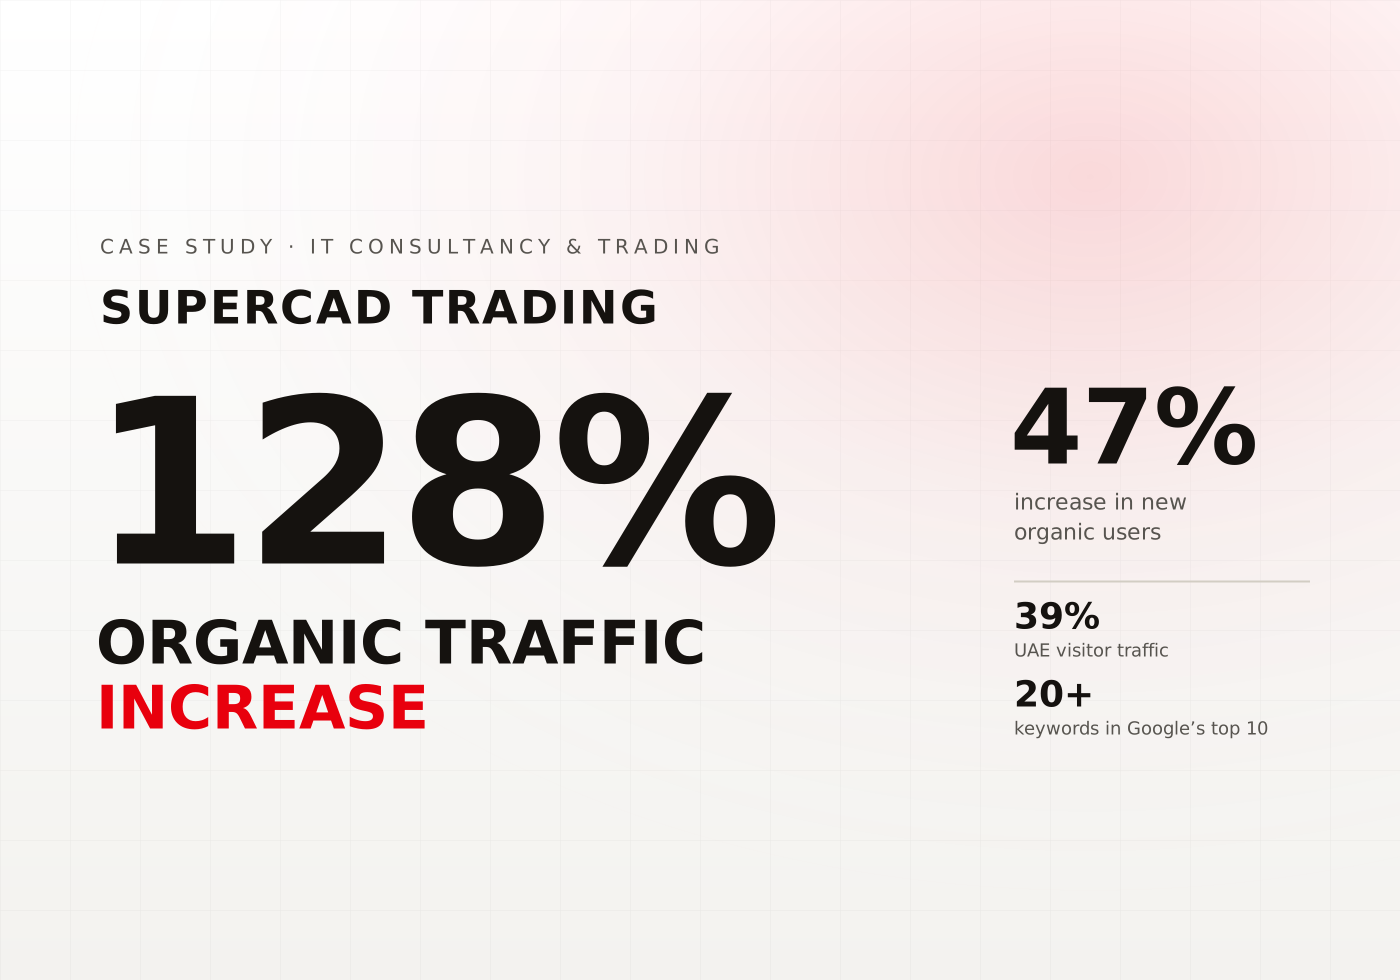
Supercad Trading case study cardSupercad Trading case study card

Supercad Trading

Revamping IT Solutions with a 128% Increase in Organic Traffic

128%
Increase in organic traffic year on year over the first 12 months
39%
Increase in traffic of UAE visitors to tap the local market over the first 12 months
47%
Increase in new users from organic traffic over the first 12 months
20
Keywords ranking in the top 10 on SERPs in the first 4 months
Read the case study
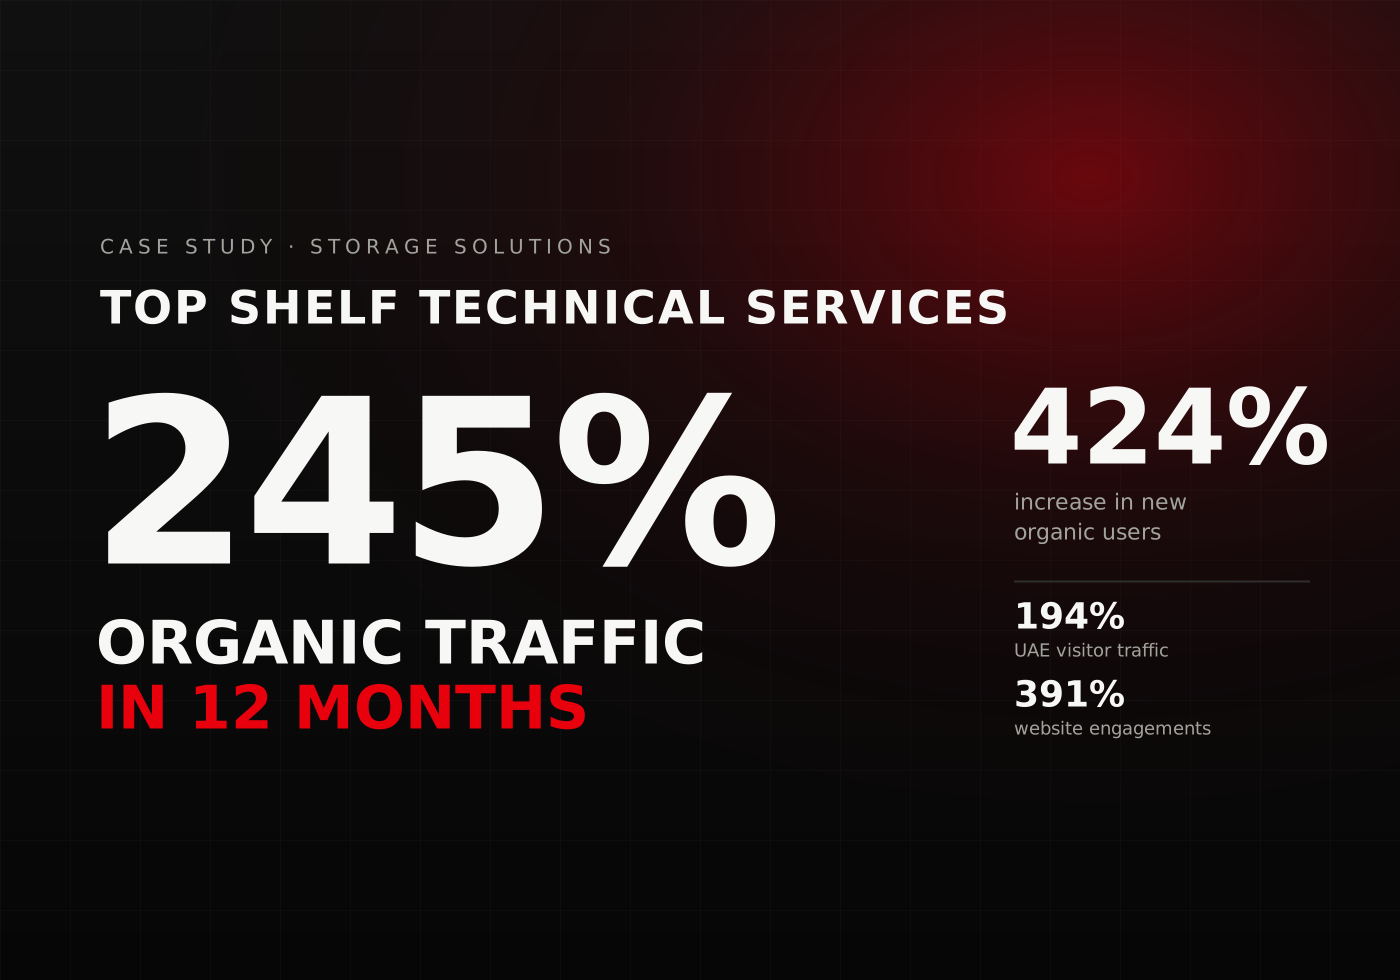
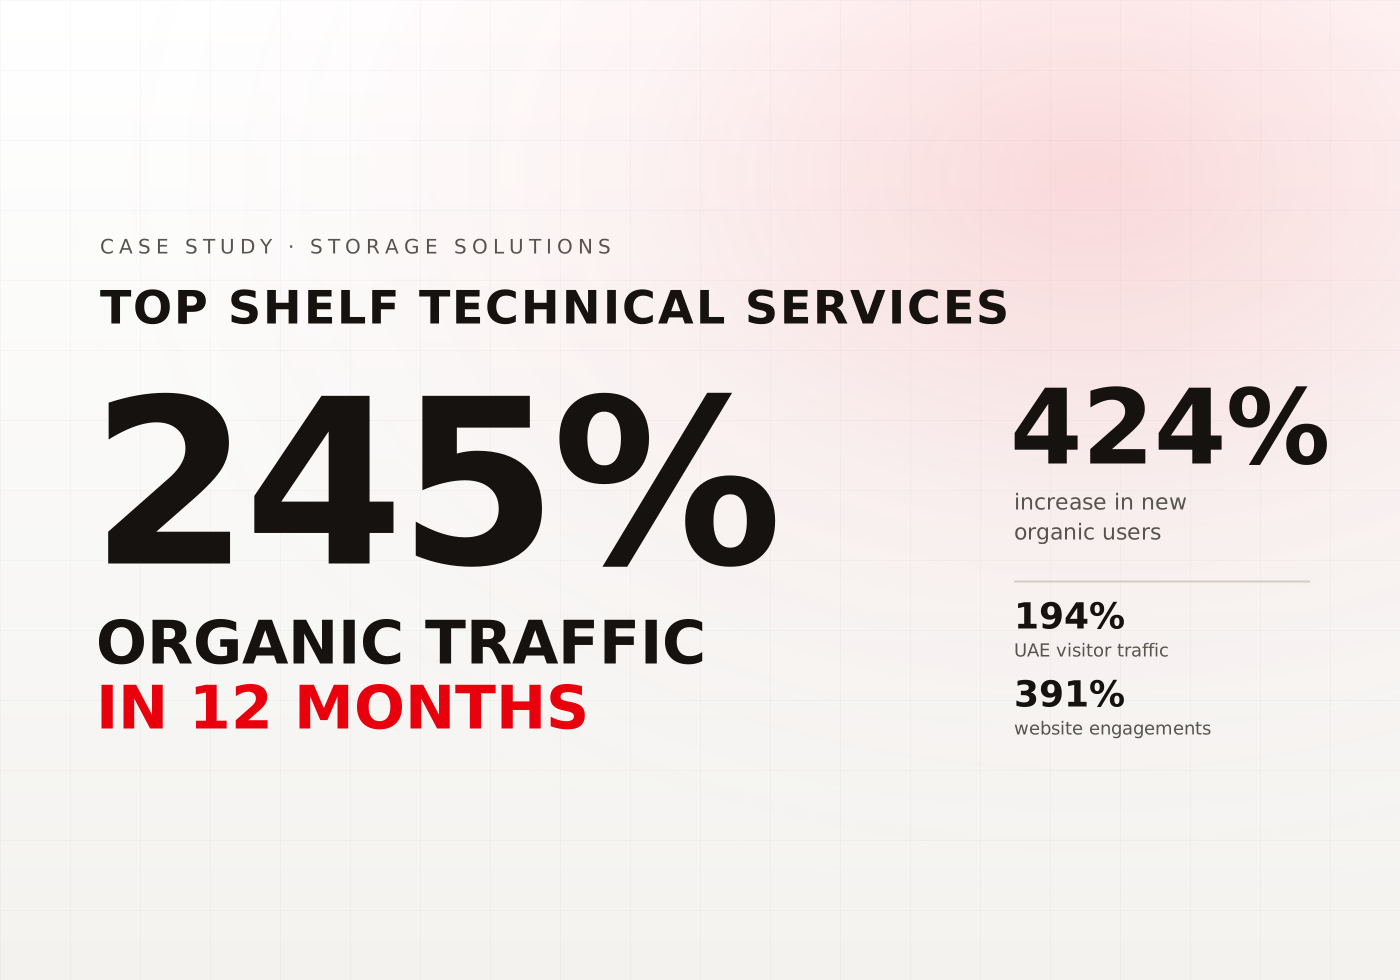
Top Shelf Technical Services case study cardTop Shelf Technical Services case study card

Top Shelf Technical Services

Boosting Organic Traffic by 245% in 12 months

245%
Increase in organic traffic year on year over the first 12 months
424%
Increase in new users from organic traffic over the first 12 months
194%
Increase in traffic of UAE visitors to tap the local market over the first 12 months
391%
Increase in traffic engagements over the first 12 months
Read the case study
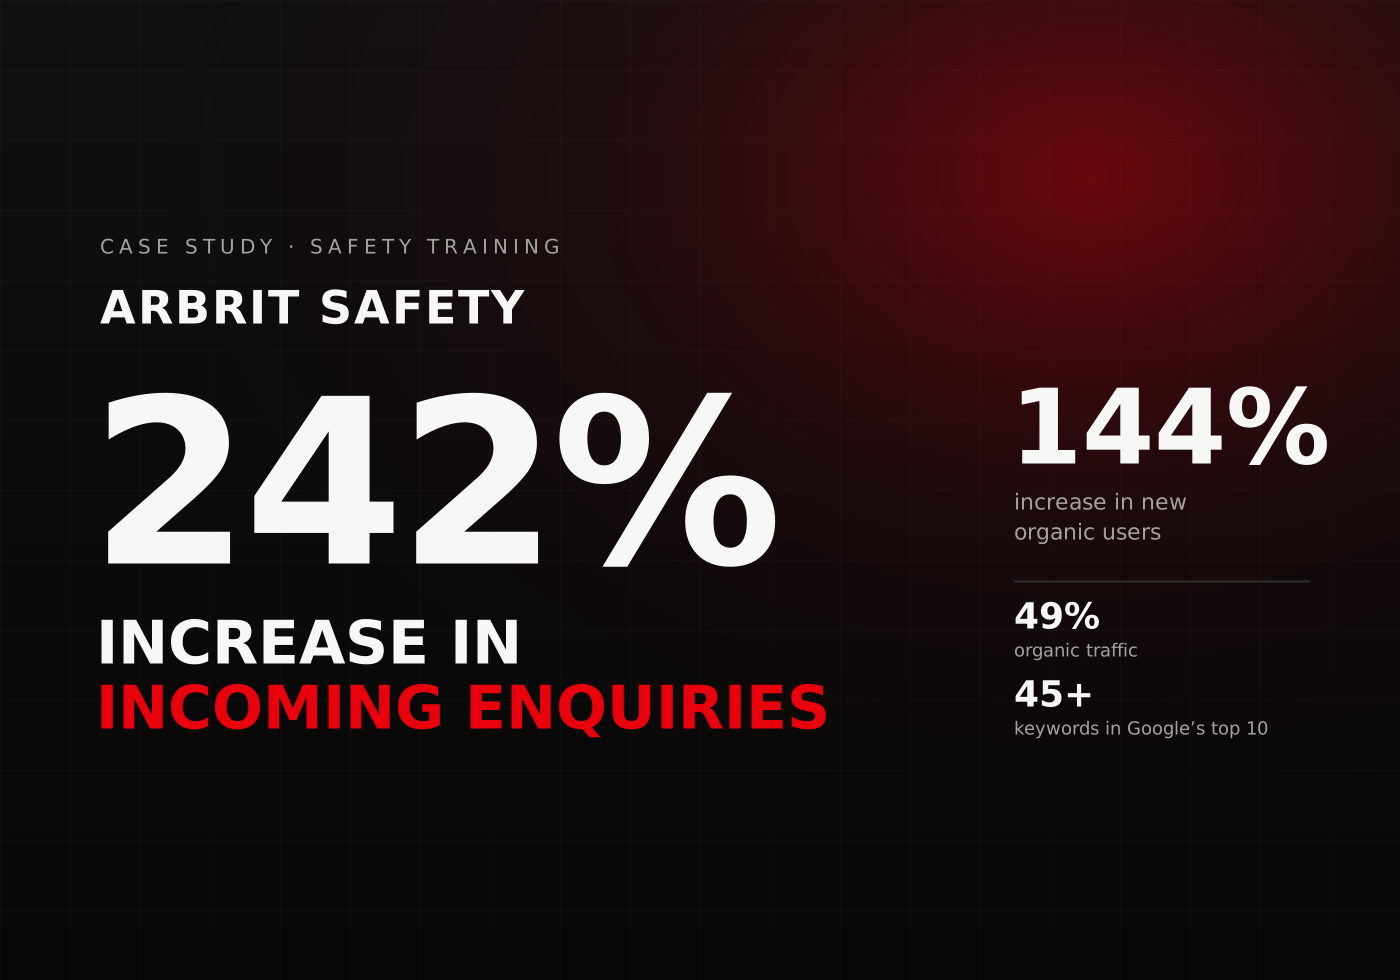
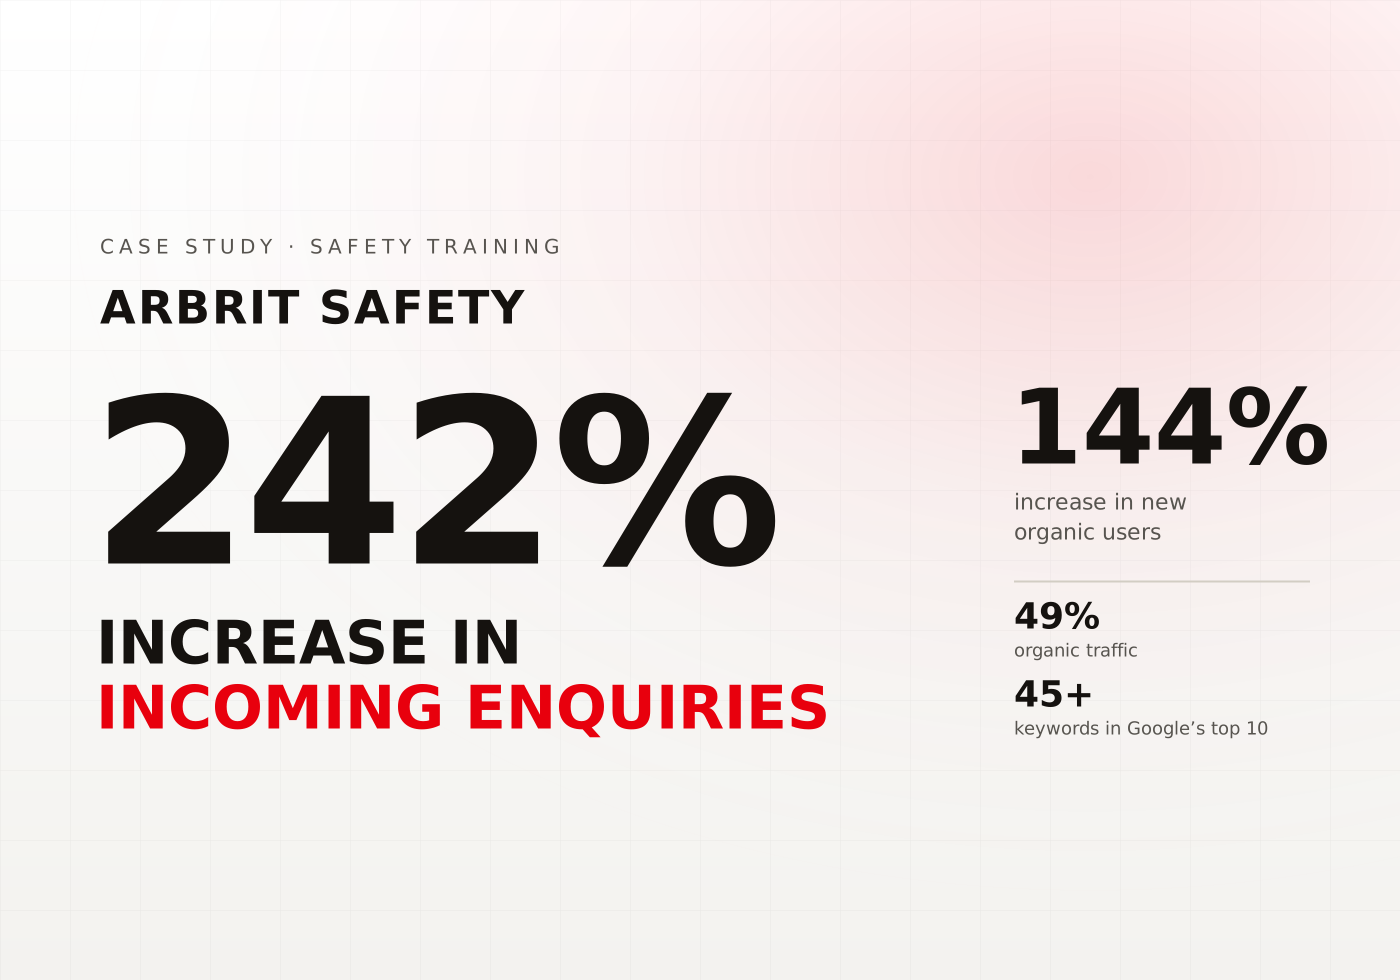
Arbrit Safety case study cardArbrit Safety case study card

Arbrit Safety

Empowering Health and Safety with a 242% Increase in Enquiries

242%
Increase in the total number of incoming enquiries
49%
Increase in organic traffic year on year over the first 12 months
144%
Increase in new users from organic traffic over the first 12 months
45+
Keywords ranking in the top 10 on SERPs in the first 12 months
Read the case study
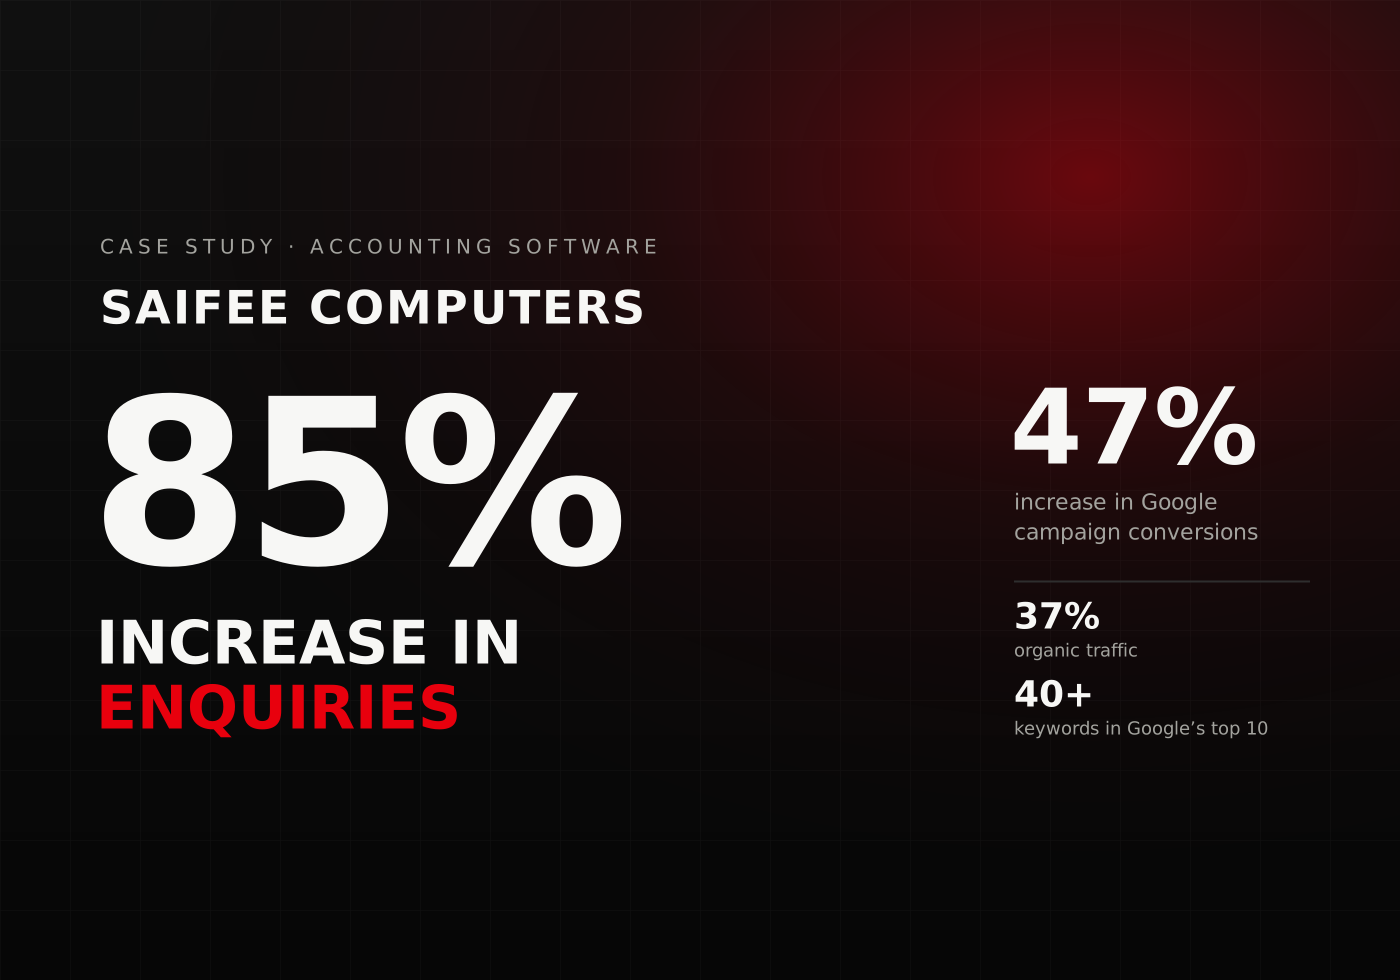
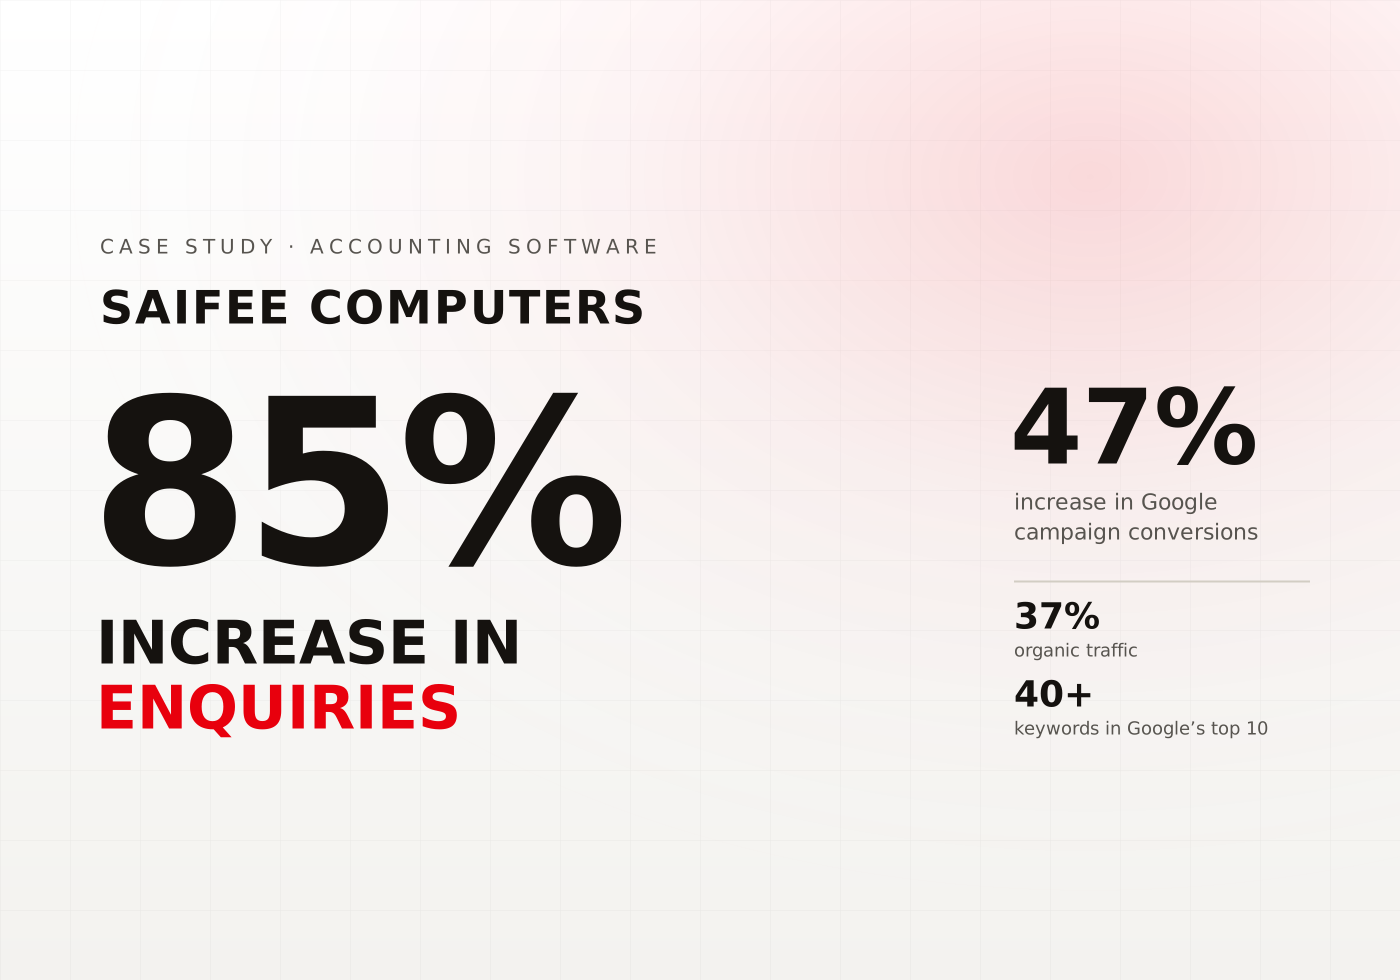
Saifee Computers case study cardSaifee Computers case study card

Saifee Computers

Accounting Software Sales with an 85% Increase in Enquiries

85%
Increase in enquiries
47%
Increase in conversions from Google campaigns over the last 6 months
37%
Increase in organic traffic year on year over the first 12 months
40+
keywords ranking in the top 10 on SERPs in the first 12 months
Read the case study
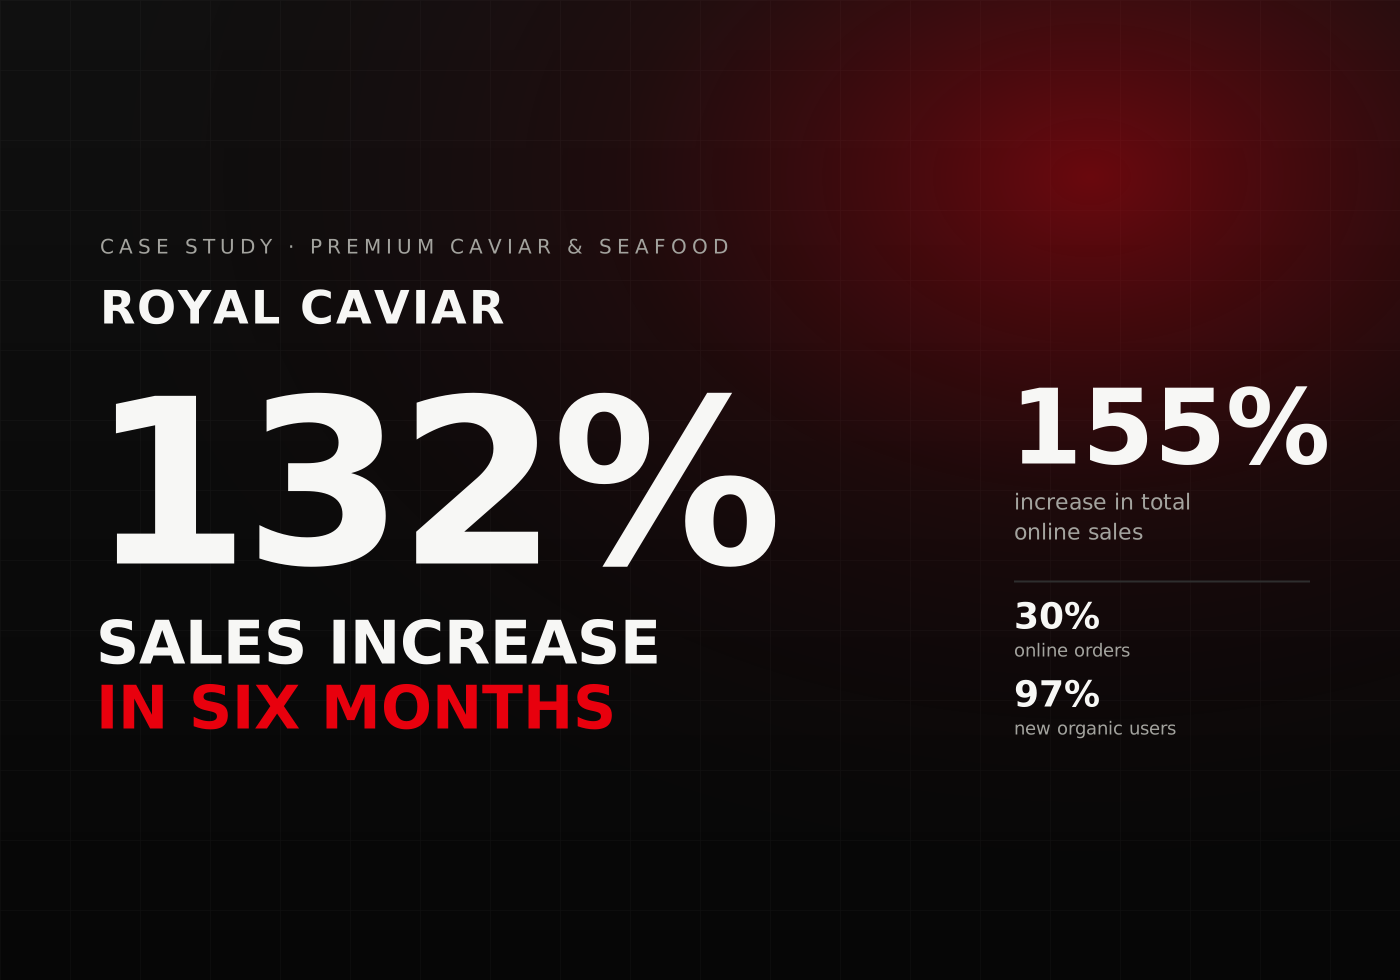
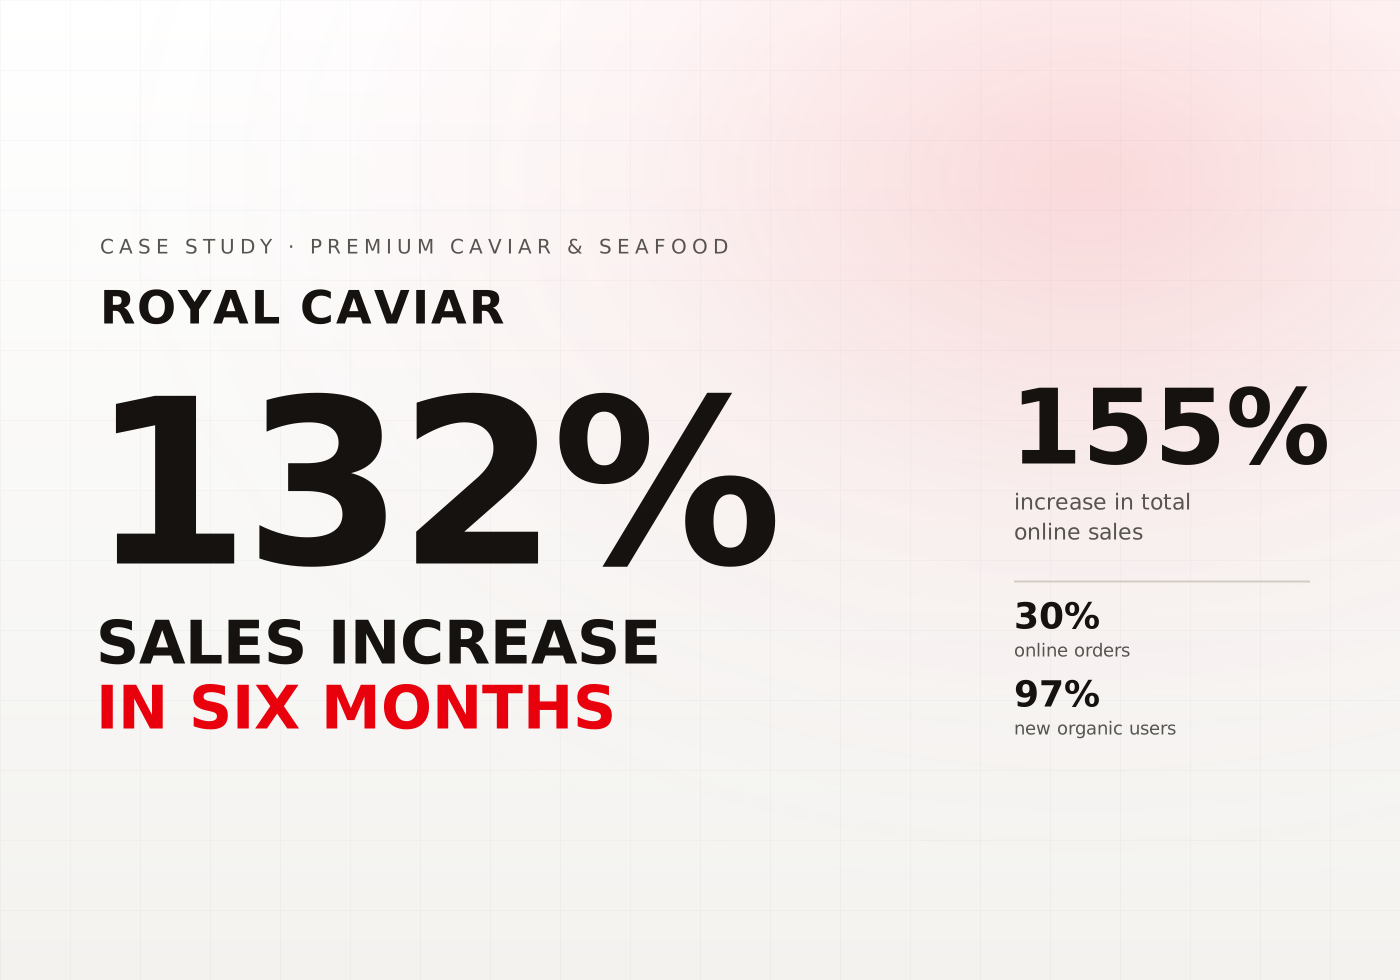
Royal Caviar case study cardRoyal Caviar case study card

Royal Caviar

Increase in sales by 132% in the First Six Months

132%
Increase in sales in the first 6 months
97%
Increase in new users from organic traffic over the first 12 months
30%
Increase in online orders over the first 12 months
155%
Increase in total online sales over the first 12 months
Read the case study
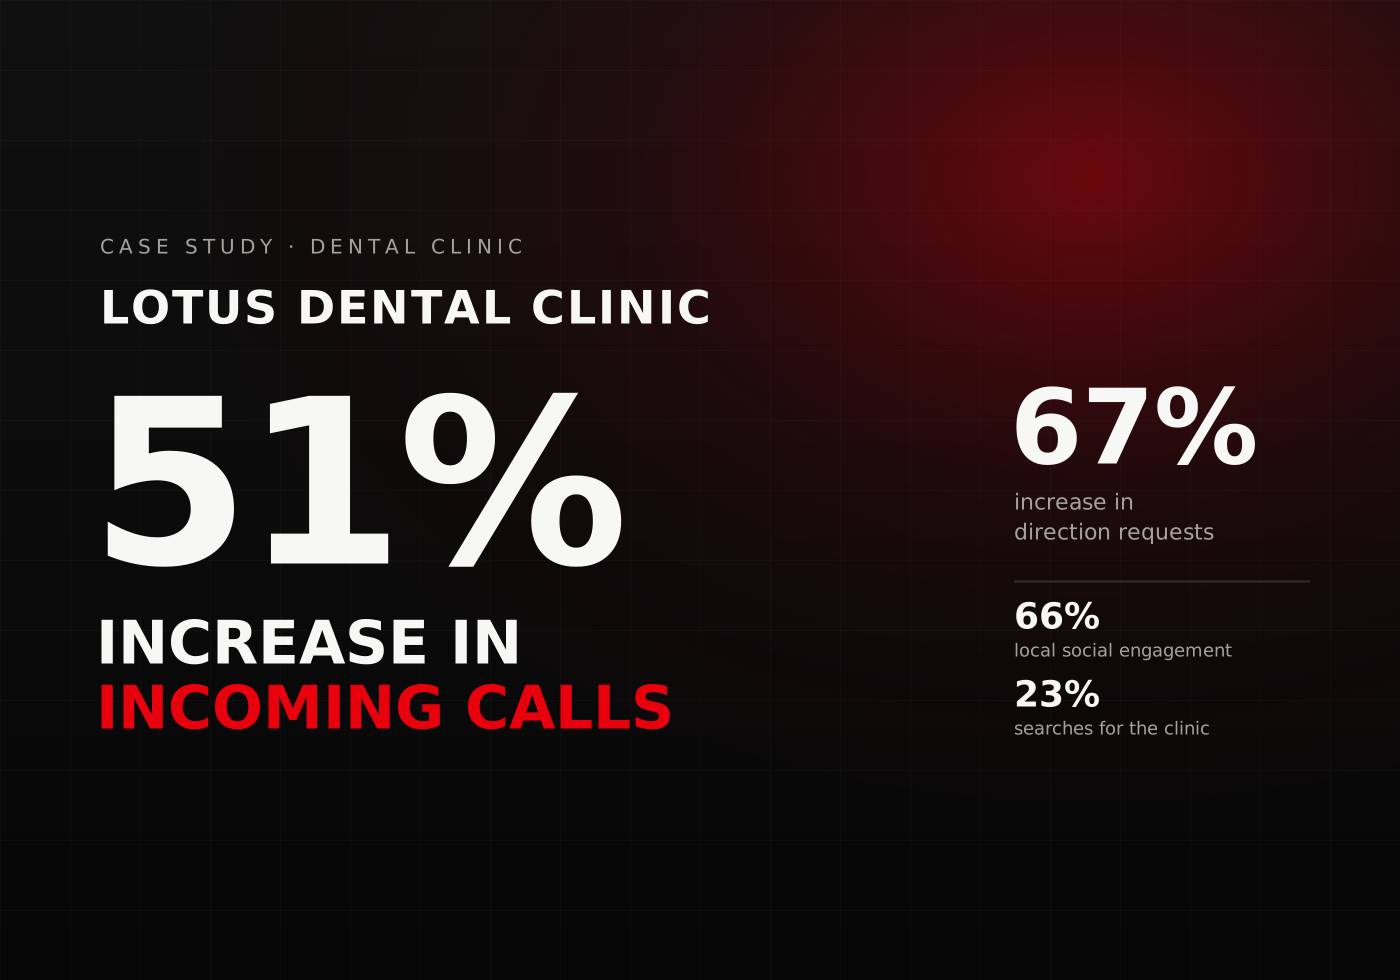
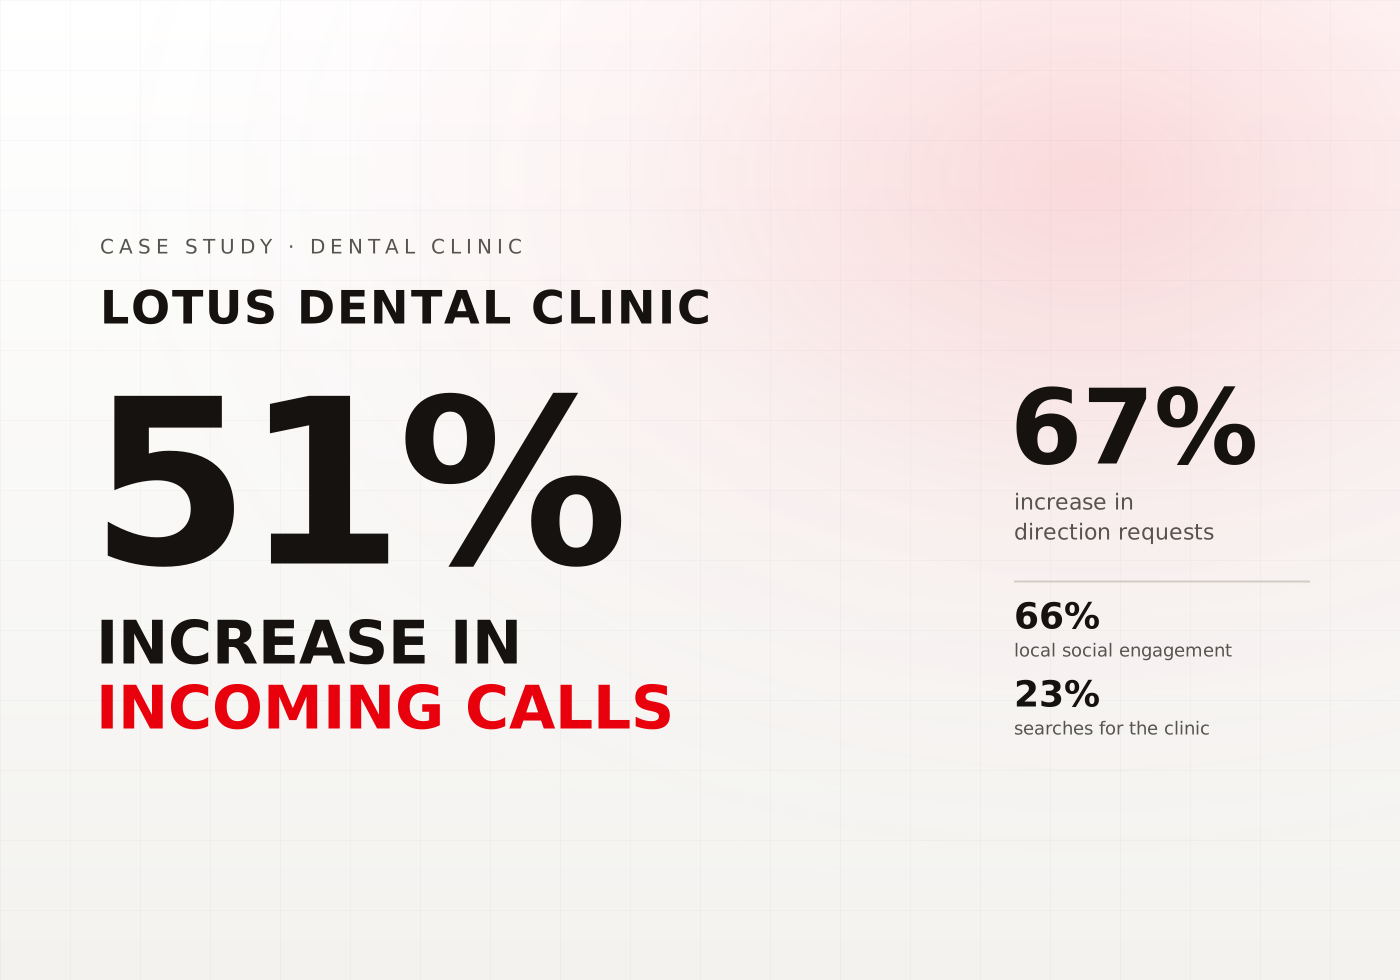
Lotus Dental Clinic case study cardLotus Dental Clinic case study card

Lotus Dental Clinic

29% Increase in Local Calls for a Dental Clinic

51%
Overall increase in incoming calls from local SEO over the first 12 months
29%
Increase in local calls in the first months of the partnership
67%
Increase in direction requests from local SEO optimization over the first 12 months
66%
Increase in local audience engagement from social media campaigns
Read the case study
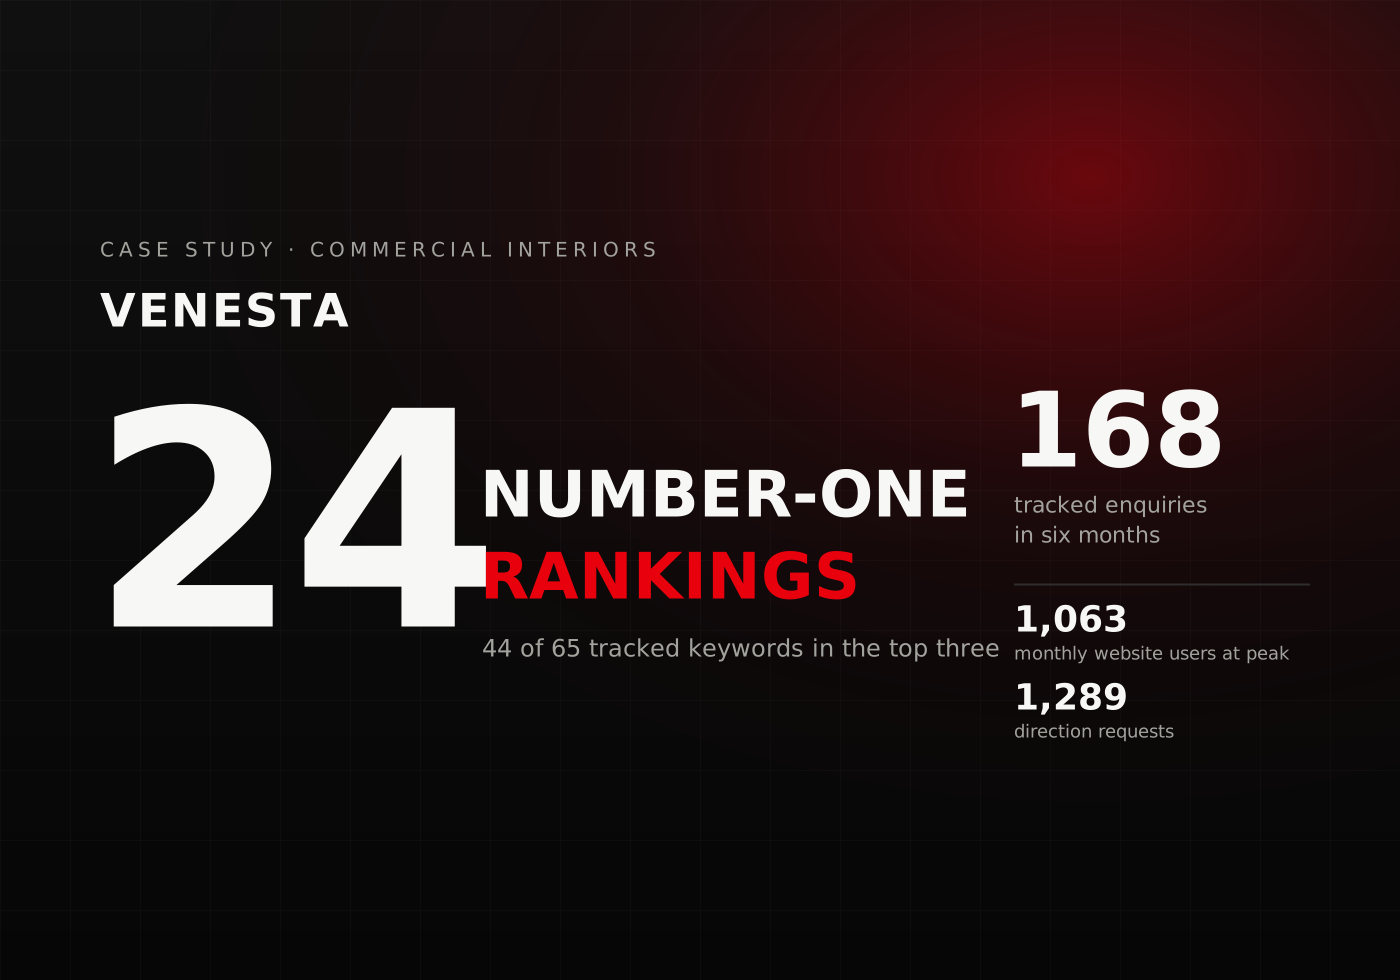
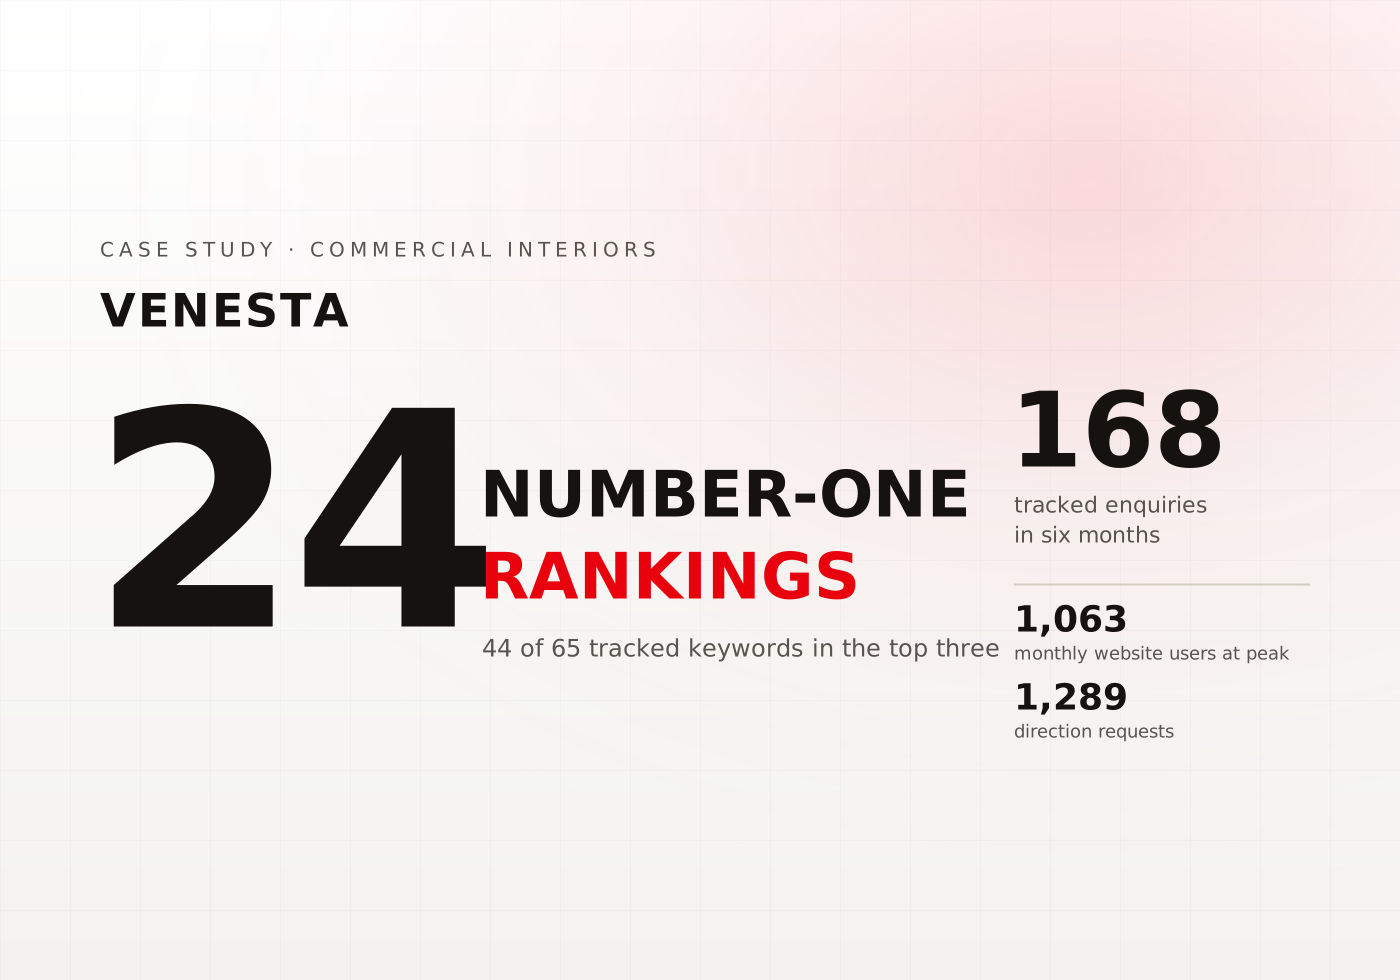
Venesta case study cardVenesta case study card

Venesta

New Market Expansion for a Washroom Solutions Provider

174%
Increase in organic traffic year-on-year over the first 12 months
101%
Increase in new users from organic traffic over the first 12 months
61%
Increase in enquiries
235%
Increase in traffic engagements over the first 12 months
Read the case study
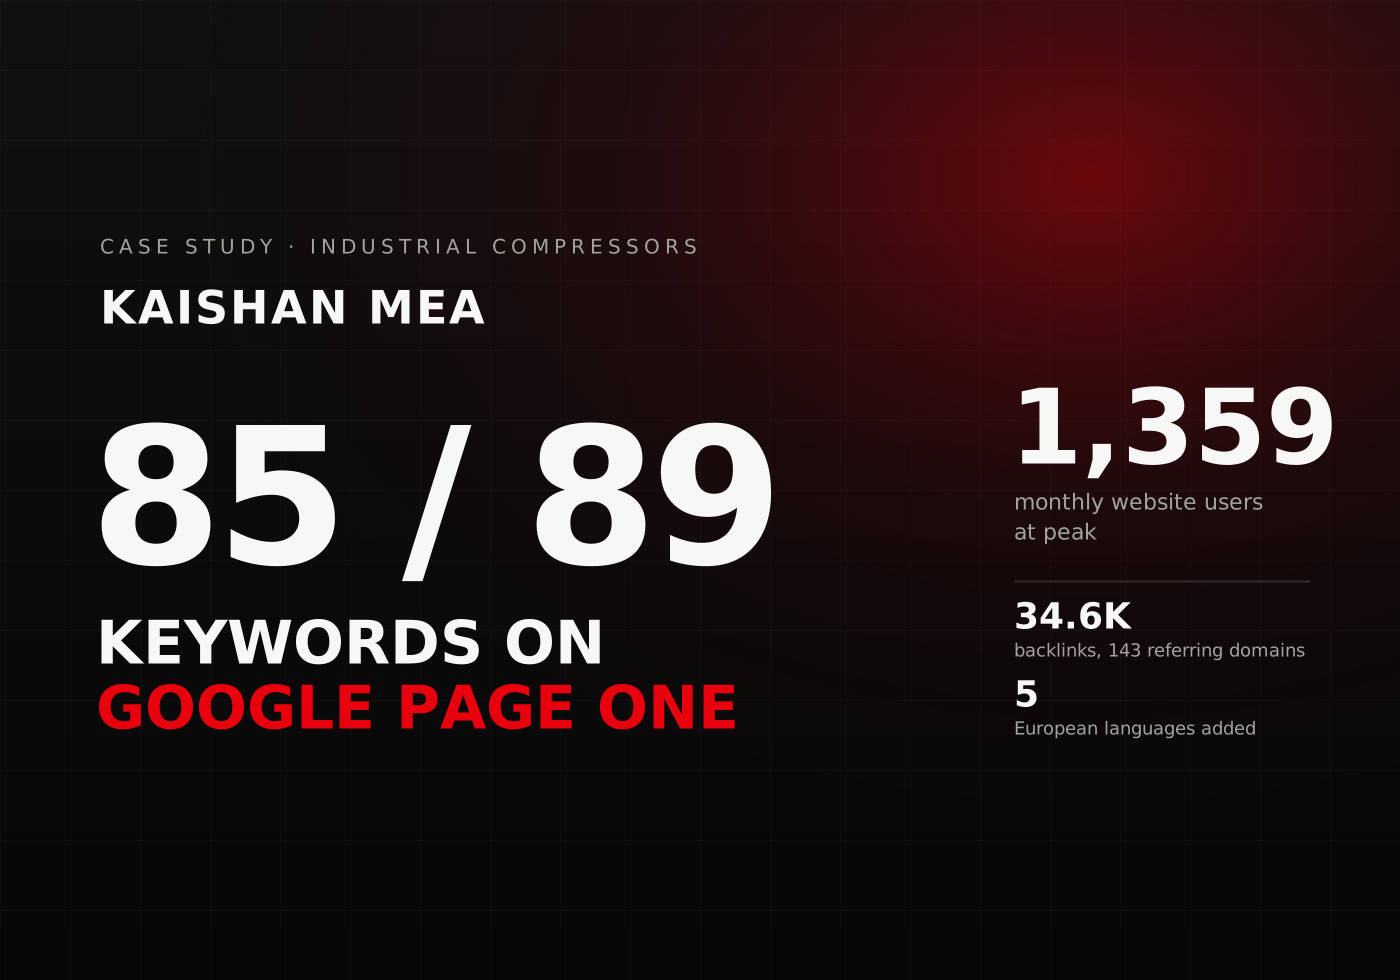
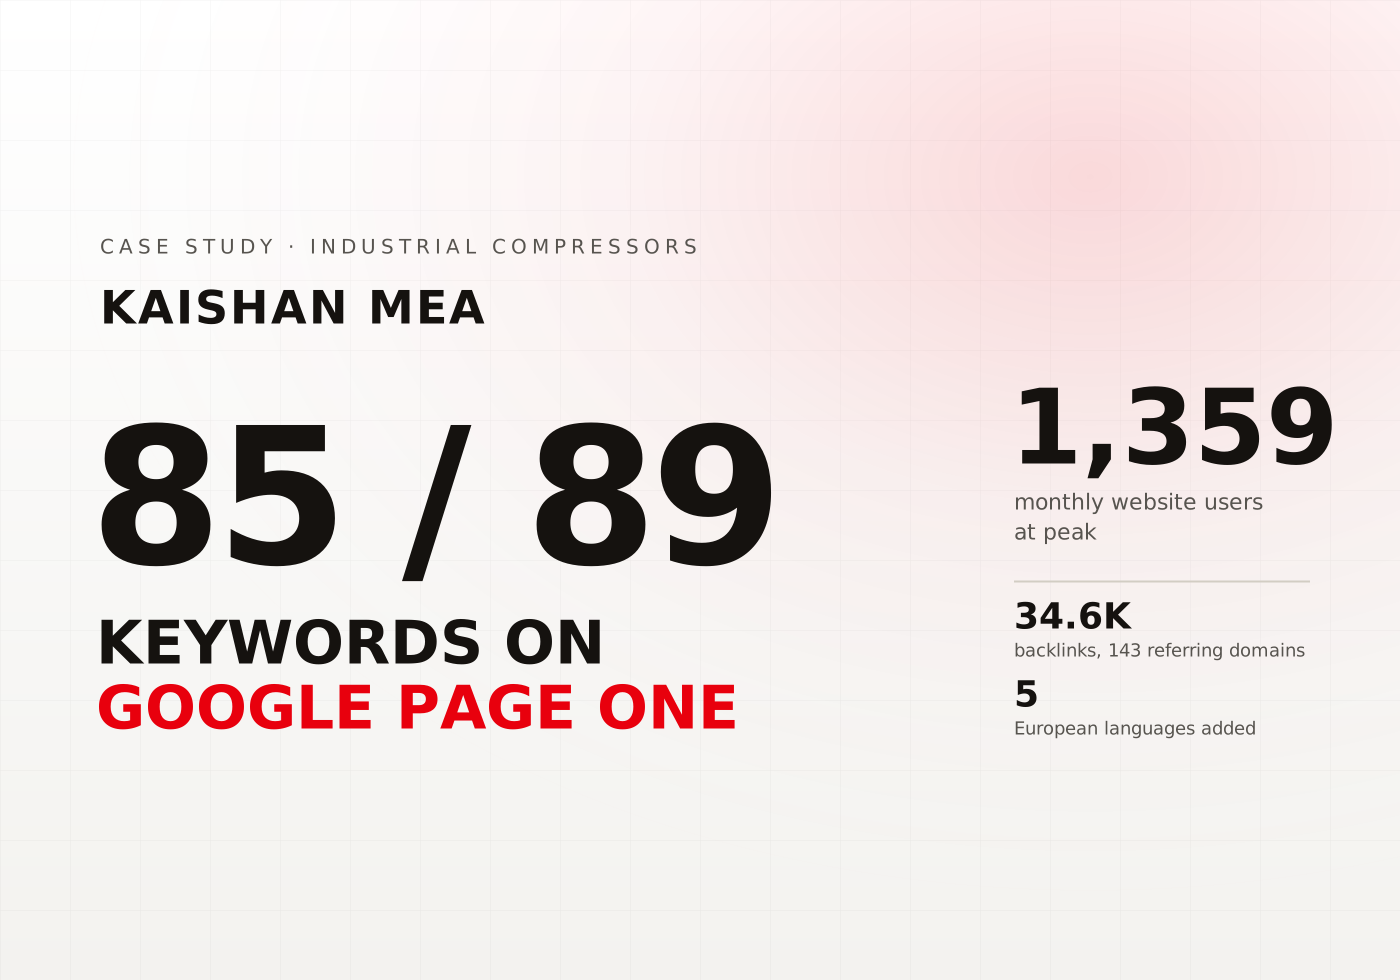
Kaishan MEA case study cardKaishan MEA case study card

Kaishan MEA

Search dominance and multilingual expansion

85 / 89
Tracked keywords in Google top 10 (first page of Google)
1,359
Monthly website users at peak
34.6K
Backlinks across 143 referring domains
5
Languages added to the European web estate
Read the case study
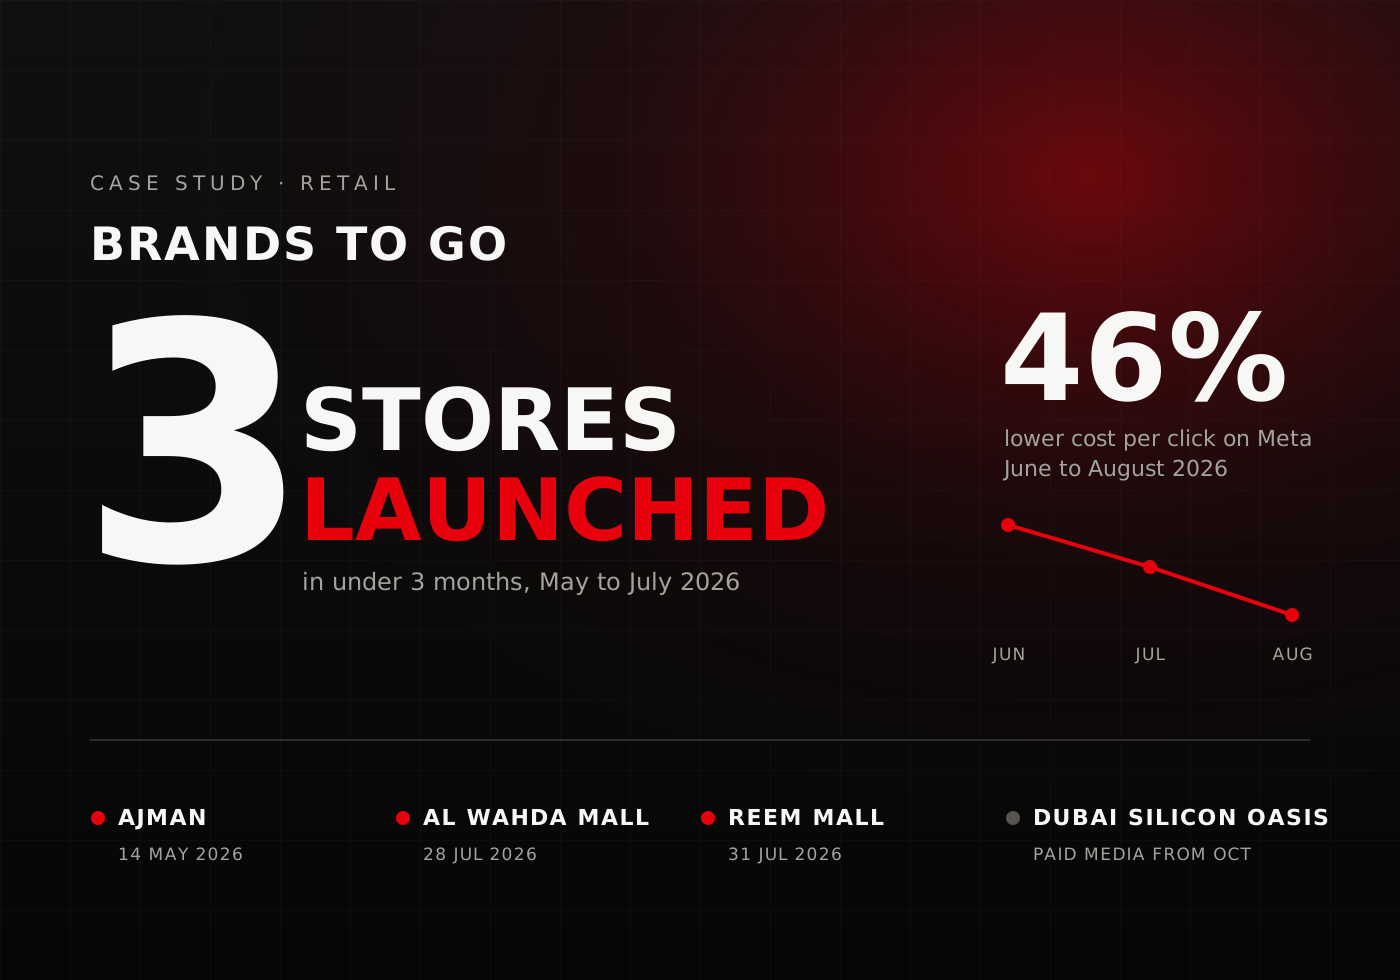
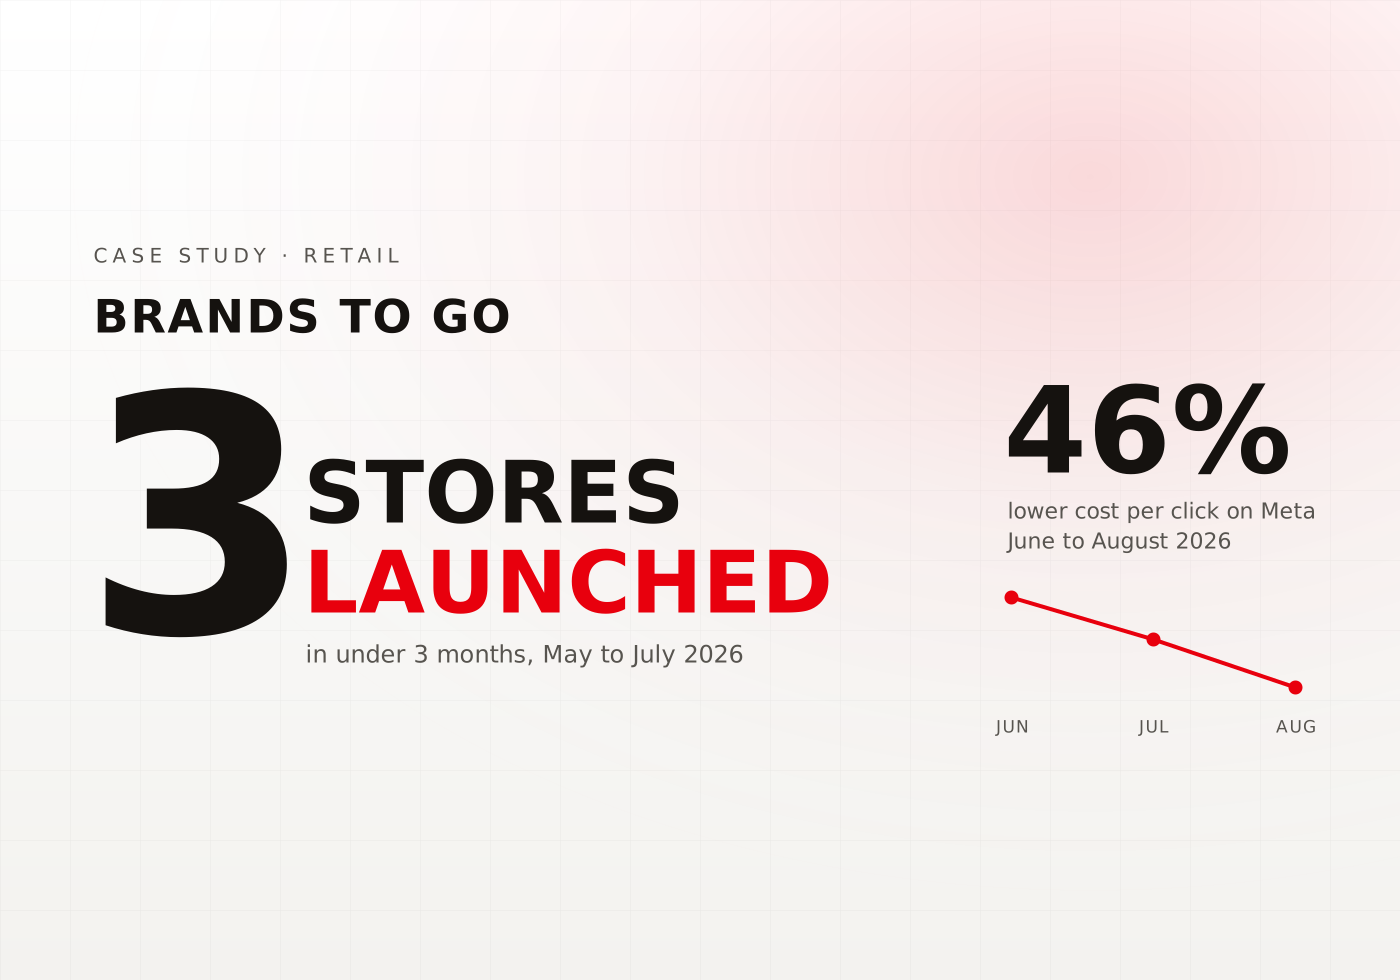
Brands To Go case study cardBrands To Go case study card

Brands To Go

Launching Brands To Go in 3 UAE Stores While Cutting Cost per Click 46%

3
stores opened in 78 days
−46%
cost per click on Meta, June to August
2.11M
people reached on Meta in launch month
3,037
direction requests to the Ajman store
Read the case study
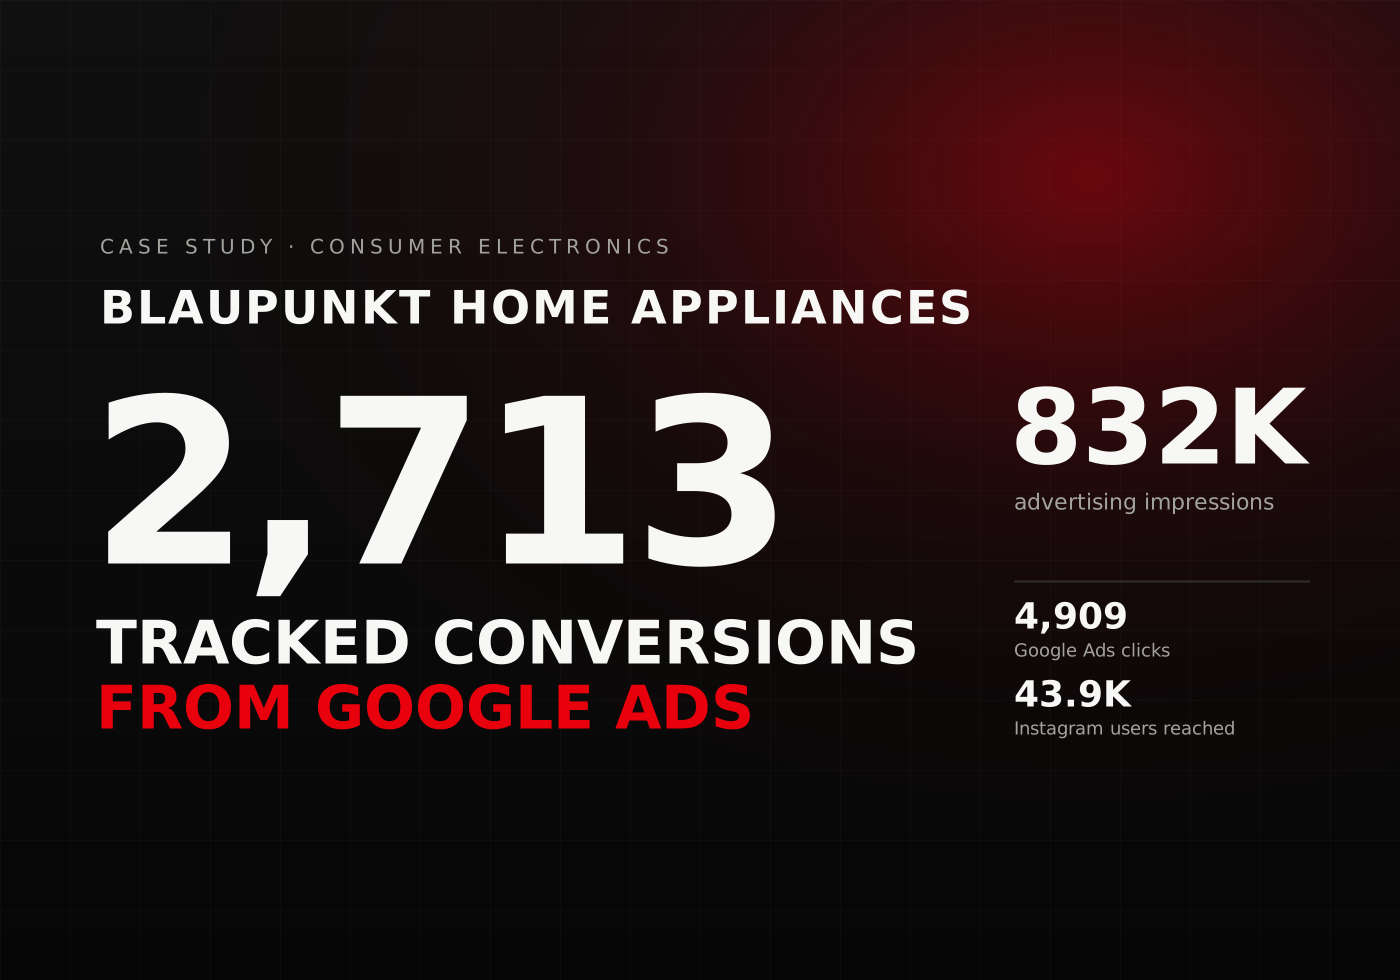
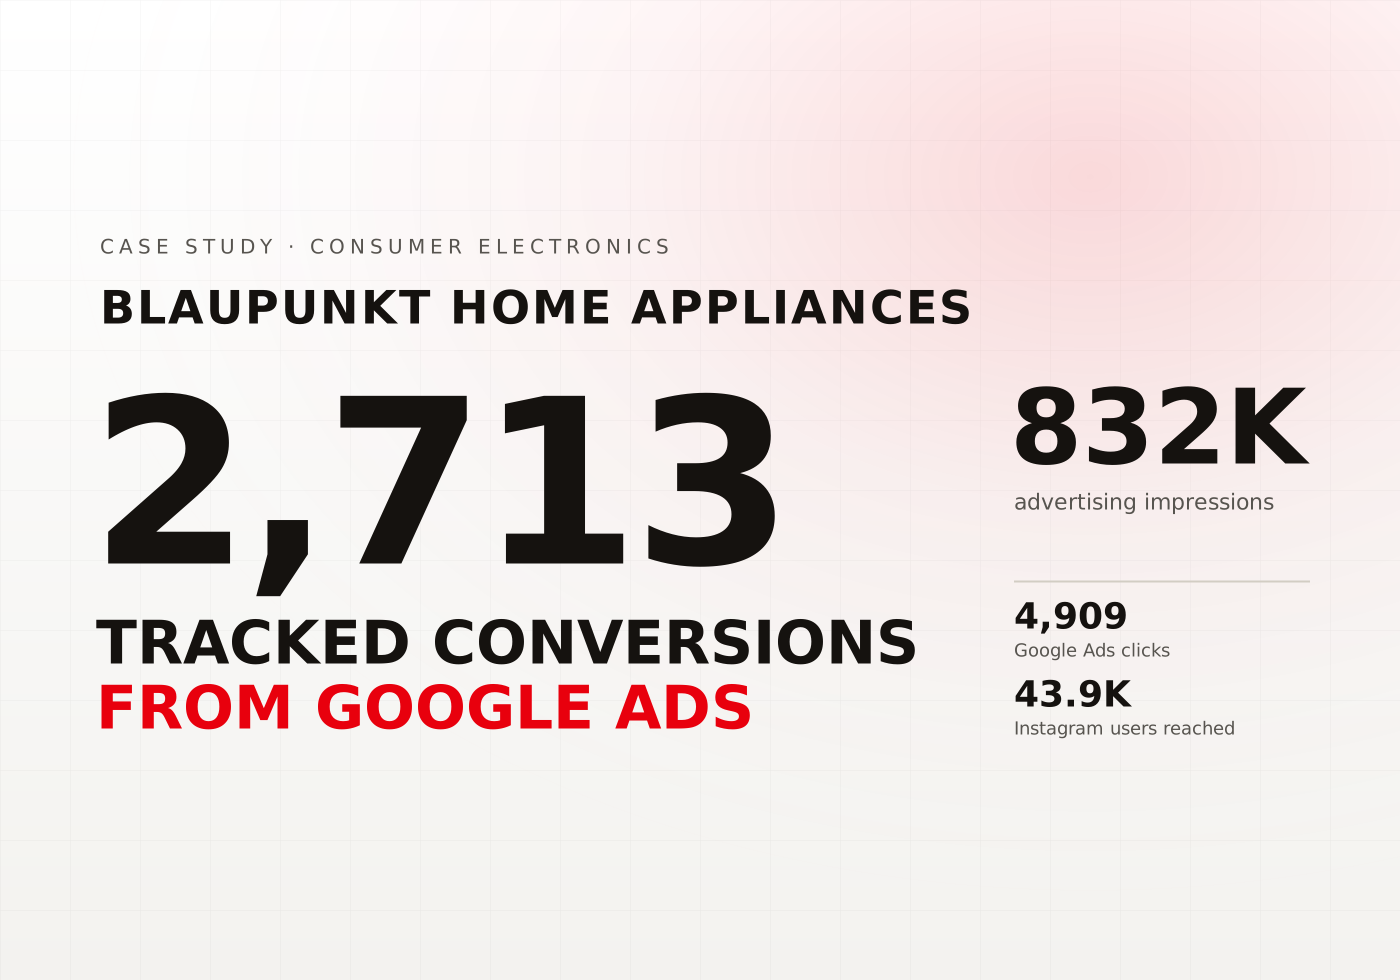
Blaupunkt Home Appliances case study cardBlaupunkt Home Appliances case study card

Blaupunkt Home Appliances

Building Digital Visibility and Driving Measurable Demand for Blaupunkt

832K
Advertising impressions generated
4,909
Google Ads clicks
2,713
Tracked conversions
43.9K
Instagram reach
Read the case study
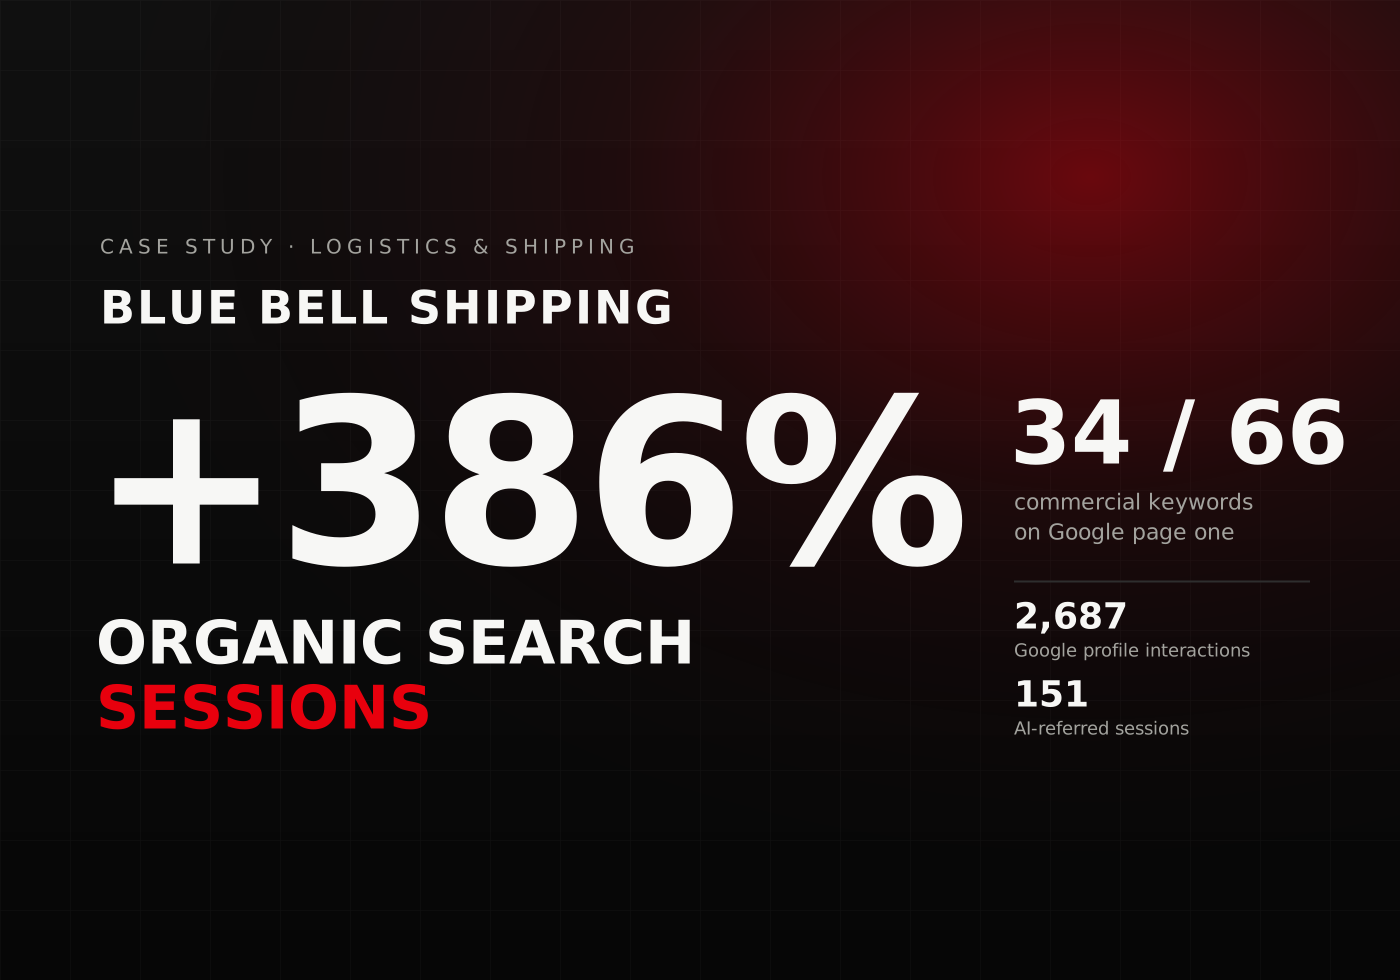
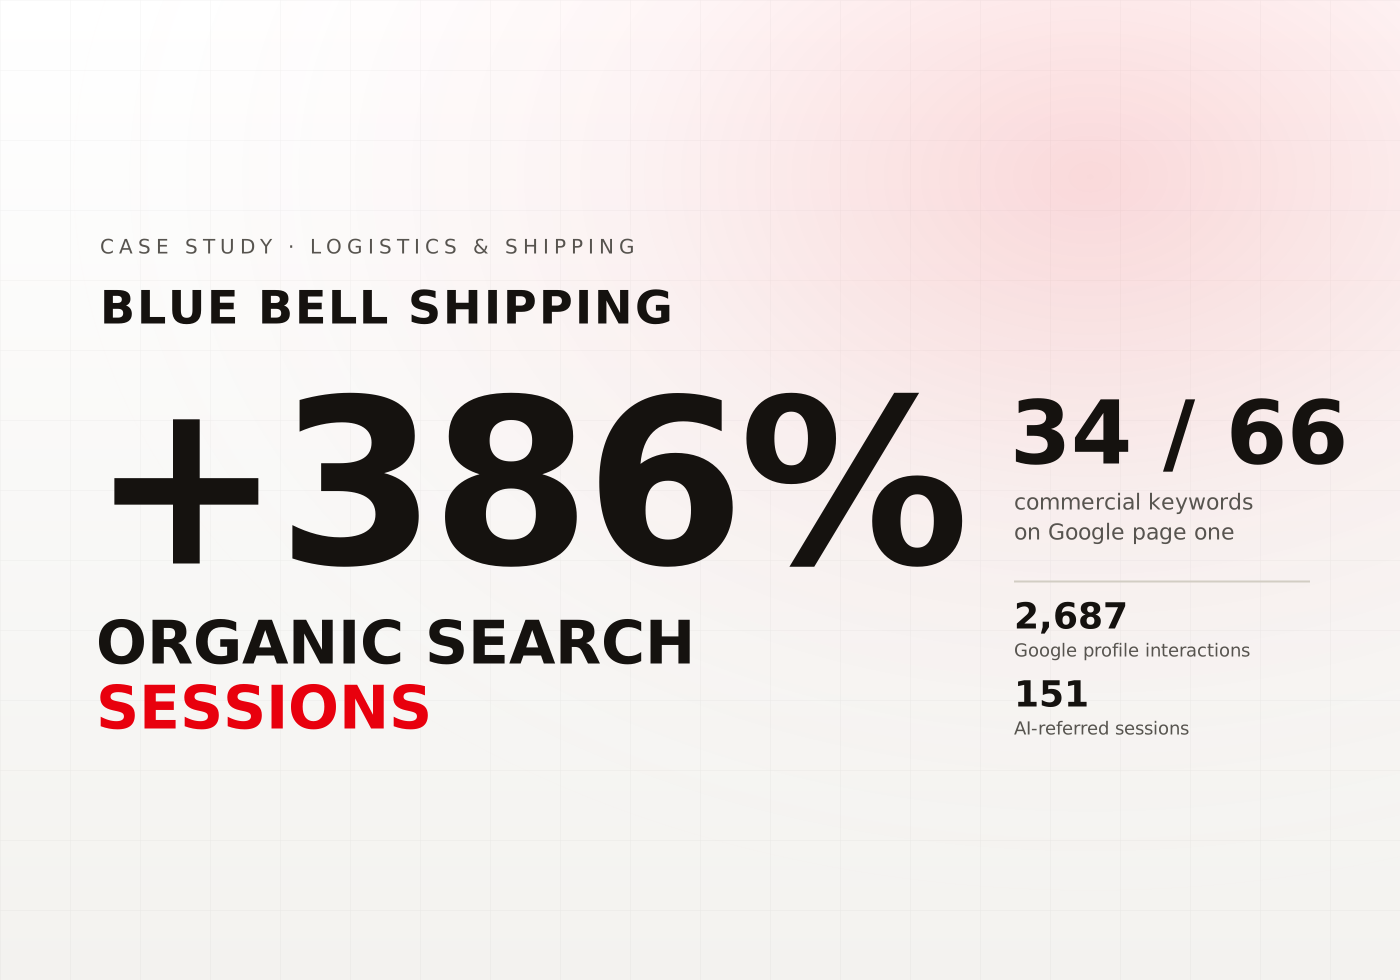
Blue Bell Shipping case study cardBlue Bell Shipping case study card

Blue Bell Shipping

Making a Logistics Brand Visible Wherever B2B Buyers Search

+386%
Organic search sessions
34 / 66
Commercial keywords on Google page one
2,687
Google Business Profile interactions
151
Sessions referred by AI platforms
Read the case study
Dubai Duty Free Tennis Championships case study cardDubai Duty Free Tennis Championships case study card

Dubai Duty Free Tennis Championships

Nine Tournaments Powered by One Purpose-Built Digital Platform

9
Tournaments supported end-to-end
36,000+
Accreditations processed
7,000+
Participant registrations completed
3–4 months
Of full-time support for each tournament
Read the case study
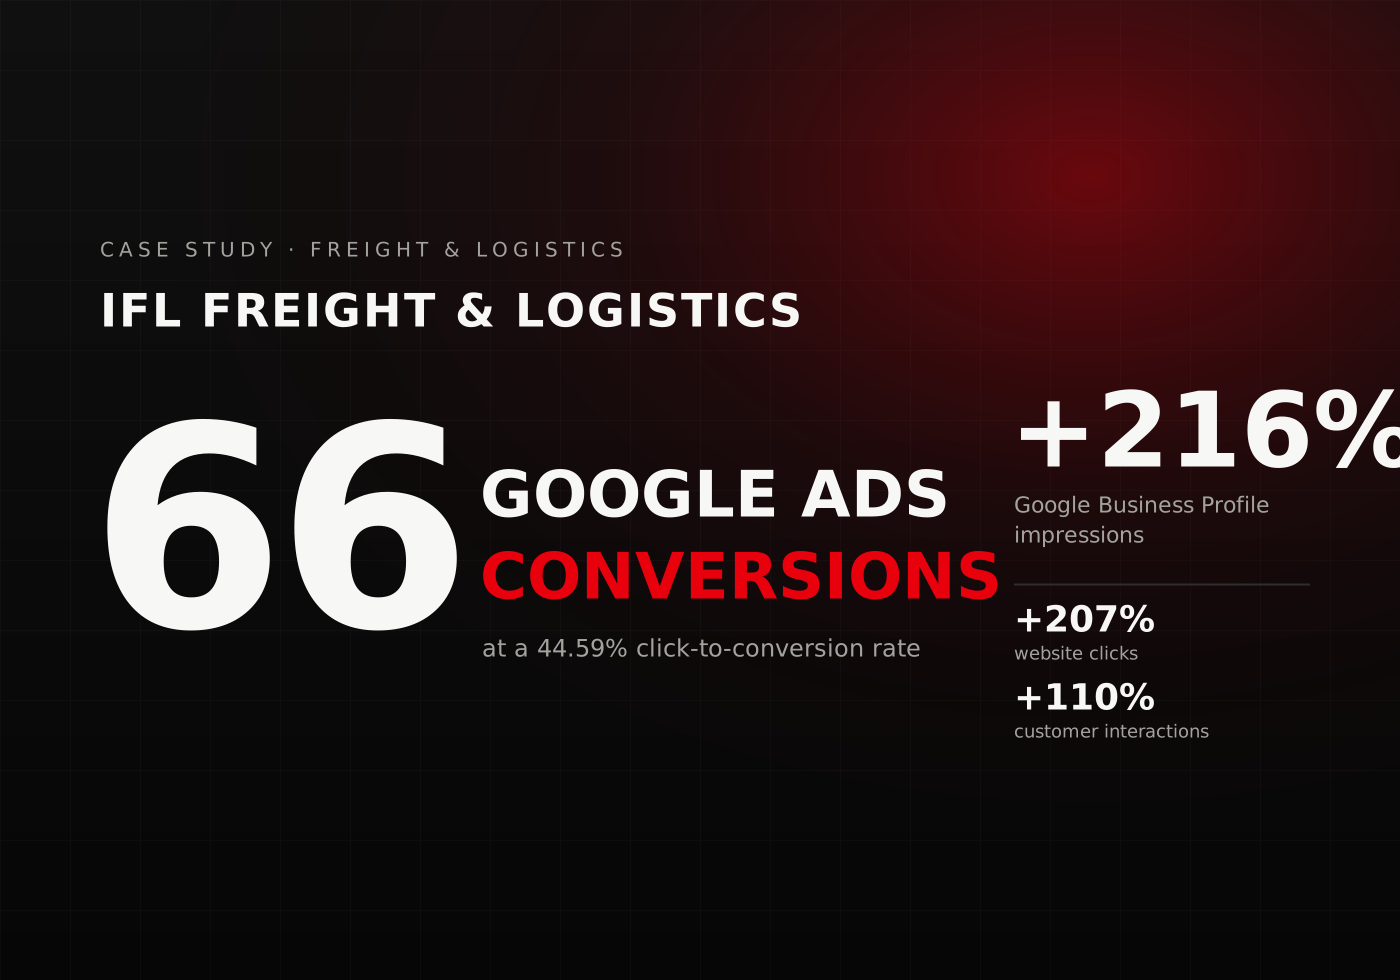
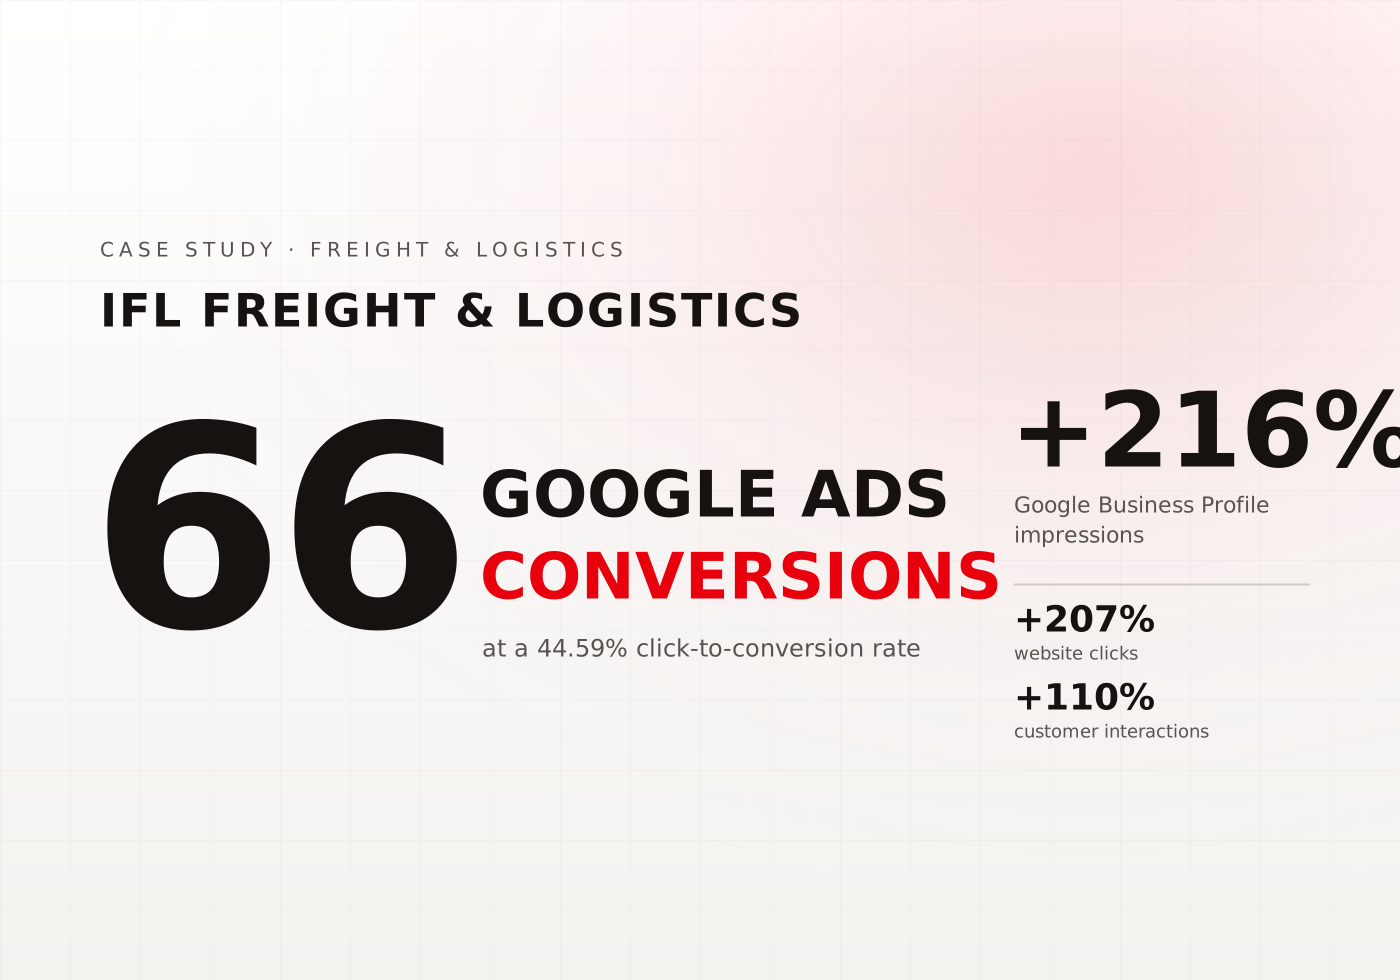
IFL Freight & Logistics case study cardIFL Freight & Logistics case study card

IFL Freight & Logistics

Engineering a Full-Funnel Growth Engine for a Logistics Business

26
Keywords ranking in Google’s top 20
+216%
Google Business Profile impressions
66
Google Ads conversions
AED 5.16
Average cost per click, with a 5.70% click-through rate
Read the case study
Your story
next?
Start the climb
Moves on its own, or drag

FAQ

Everything you need to know about working with Dubai’s result-driven digital marketing agency.

Campaign intelligence uses historical data, benchmarks, forecasts and live performance information to support marketing decisions. It helps teams decide how much to spend, where to allocate the budget and when a campaign needs attention.

We review comparable campaign data, expected media costs, conversion rates, your previous performance, and the objective of the new campaign. The result is provided as a forecast range with clear assumptions. It is not presented as a guaranteed outcome.

There is no single UAE benchmark that applies to every business. A useful benchmark must consider the industry, platform, audience, offer, location, lead definition and commercial value of the enquiry.

We use the client’s own historical data and relevant ENH campaign data where enough comparable information is available. The proposal will explain which data sources are being used and any limitations that affect the benchmark.

Normal reporting explains what happened after the campaign ran. Campaign intelligence also estimates what should happen before the budget is spent and monitors whether actual performance remains within the expected range.

Not necessarily. Campaign intelligence can be provided while your internal team or another agency manages the campaigns. We will need suitable access to the media, analytics and sales data included in the scope.

We will not force an unrelated industry benchmark onto the forecast. If comparable category data is limited, we use your own history, platform data and early campaign results. The forecast range will be wider until more reliable information is available.

There is no standard accuracy percentage that applies to every forecast. Accuracy depends on the amount, quality and relevance of the available data. It is also affected by changes in creative, competition, tracking, offers, landing pages and sales follow-up. We show the forecast as a range and explain what could move the result.

Predictive marketing analytics uses historical and current data to estimate possible future campaign outcomes. For campaign planning, this may include expected lead volume, acquisition cost, revenue, channel performance and the effect of different budget scenarios.

Not always. Media mix modelling is useful when a business has enough reliable historical data across several channels and time periods. Smaller or newer datasets are usually better suited to channel forecasting and scenario planning.

The budget should be connected to the required outcome and a realistic acquisition-cost range.

For example, if the target is 100 qualified leads and the forecast cost per qualified lead is AED 200 to AED 300, the working media budget would need to reflect that range. Agency fees, production and other campaign costs should be calculated separately.

The service is priced according to the number of campaigns, channels, markets, data sources and reporting requirements. It is usually provided on a retained basis. The proposal will separate the campaign intelligence fee from media spend, production and paid media management.

Tell us what the campaign needs to achieve, the budget being considered, and what performance data is currently available.

We will assess whether there is enough information to build a useful forecast and show what should be included in the campaign intelligence scope. If the available data does not support a reliable benchmark, we will state that before the work begins.
Protected by reCAPTCHA. Google’s Privacy Policy and Terms of Service apply.